
.jpg)


Source: Copyright © 2021 Kalkine Media Pty Ltd.
The US benchmark indices S&P 500 and Dow Jones Industrial Average set new closing records on Friday, April 9, 2020, as healthcare and technology stocks made a strong comeback later in the session to offset the losses in other sectors and investors weighed encouraging labor-market data.
The S&P 500 rose 0.77 percent to 4,128.80. The Dow Jones rallied 0.89 percent to 33,800.60. The NASDAQ Composite Index was up 0.51 percent to 13900.19 while the small-cap Russell 2000 Index edged up 0.4 percent to 2,243.47.
The producer price index for final demand in the U.S. rose 1 percent in March following a 0.5 percent and 1.3 percent growth in February and January respectively, according the U.S. Bureau of Labor Statistics.
Meanwhile, top government officials including the National Security Adviser Jake Sullivan and National Economic Council Director Brian Deese will reportedly meet senior executives of companies such as Ford Motor Co. (NYSE:F), General Motors Co. (NYSE:GM), Intel Corp. (NASDAQ:INTC) and Alphabet Inc. (NASDAQ:GOOGL) on Monday to discuss the global chip shortage.
Meanwhile, the European Central Bank President Christine Lagarde reportedly said the European Union is expected to see its economy recover faster in the second half of the year. Lagarde also expects the U.S. to meet inflation targets soon. The IMF recently forecasted the EU to grow at 4.4 percent this year.

Source: Pixabay
Top Gainers
Top performers on S&P 500 were PVH Corp. (5.23%), Tapestry Inc. (3.39%), IPG Photonics Corp. (3.29%) and Lennar Corp. (3.35%).
Celcuity Inc. (50.94%), Affimed NV (23.45%), Briacell Therapeutics Corp. (18.95%) and GT Biopharma Inc. (18.77%) were top performers on NASDAQ.
On Dow Jones, Honeywell International Inc. (3.24%), UnitedHealth Group Inc. (3.13%), Salesforce.Com Inc. (3.04%) and Apple Inc,. (2.02%) gained the most.
Top Losers
Top laggards on S&P 500 were Molson Coors Beverage Co. (3.06%), Conagra Brands Inc. (3.00%), Baker Hughes Co. (2.90%) and Cabot Oil & Gas Corp. (2.63%)
Franklin Wireless Corp. (23.79%), Novo Integrated Sciences Inc. (23.46%), Virpax Pharmaceuticals Inc. (19.00%), Medalist Diversified Reit Inc. (18.57%) were among top losers on NASDAQ.
On Dow Jones, Walgreens Boots Alliance Inc. (1.11%), Johnson & Johnson (1.06%), Boeing Co. (1.02%) and Procter & Gamble Co. (0.65%) were laggards.
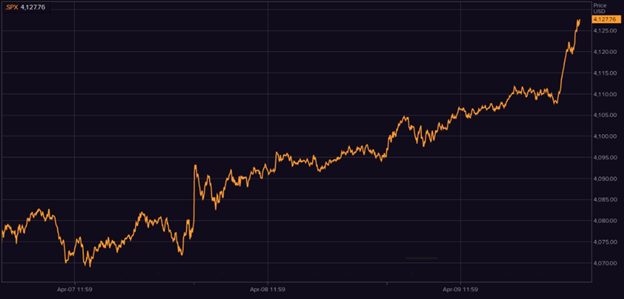
Image Source: EODHD/Others, S&P 500 five days price chart
Volume Movers
Top volume movers on Friday were Naked Brand Group Ltd. (29.57M), Apple Inc. (21.00M), Castor Maritime Inc. (12.24M), Affimed NV (12.05M), ViacomCBS Inc. (11.82M), General Electric Co. (10.83M) and Sundial Growers Inc. (10.81M).
Futures & Commodities
Gold futures declined 0.84 percent to US$ 1,743.50 per ounce on Friday. Silver fell 1.08 percent to US$ 25.308 per ounce and copper dropped 1.11 percent to US$ 4.0492.
Brent oil futures dropped slightly by 0.27 percent to US$ 63.03 per barrel and WTI crude fell 0.40 percent to US$ 59.36 per barrel.
Bond Market
The 30-year Treasury bond yield grew 0.65percent to 2.337 while the 10-year bond yield was up 1.95 percent to 1.664.
US Dollar Futures Index also inched up 0.11percent on Friday evening to US$92.170.
