


PLANO, Texas, Nov. 12, 2024 (SEND2PRESS NEWSWIRE) — Optimal Blue today released its October 2024 Market Advantage mortgage data report, highlighting resilient purchase activity in the face of rising interest rates and affordability challenges. Despite a 65-basis-point (bps) increase in the Optimal Blue Mortgage Market Indices (OBMMI) 30-year conforming rate, purchase lock volume grew by 12% month over month (MoM), signaling strong demand among homebuyers. The report also shows a notable shift away from conforming loans, indicating affordability concerns are pushing buyers toward alternative financing options.
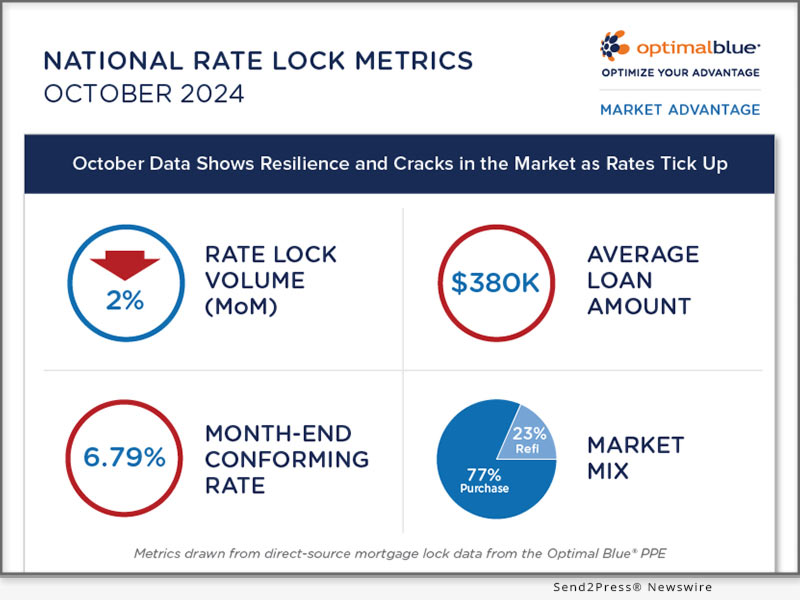
Image caption: Optimal Blue: National Rate Lock Metrics Oct. 2024.
“Despite a tough rate trajectory, we saw strong growth in both purchase lock volume and counts, which are both positive signals for mortgage production,” said Brennan O’Connell, director of data solutions at Optimal Blue. “While purchase growth is encouraging, signs of how buyers are adapting to higher rates indicate continued affordability pressures. Production mix data shows a shift from conforming loans to FHA and non-conforming products, which often offer more flexible financing terms.”
Key findings from the Market Advantage report, which are drawn from direct-source mortgage lock data, include:
- Rates rise across the board: The OBMMI 30-year conforming rate ended October at 6.79%, marking a 65-bps increase from September. FHA rates rose by 54 bps to 6.43%, while VA rates saw the largest increase, climbing 73 bps to 6.36%. The OBMMI jumbo index rate rose a more moderate 41 bps to end at 6.82%.
- Purchase lock volume grows despite rate increases: Purchase lock volume rose 12% MoM. Also significant, purchase lock counts – which are a key measure for market health that excludes the impact of HPA and volatile refi activity – rose 9% year over year (YoY), continuing a positive trend that started in September. This increase in purchase locks reflects ongoing demand.
- Affordability concerns shift production mix: Conforming loan share fell to its lowest point since tracking began in 2018, now representing 53% of volume. At the same time, FHA locks rose, accounting for one in five purchase transactions, as buyers sought more accessible financing options. Non-conforming loans also gained ground as borrowers leaned more heavily on non-QM and jumbo loans to adapt to affordability challenges.
- Refinance demand softens: The rise in rates dampened refinance interest, with rate-and-term refinance volume dropping 45% MoM. Cash-out refinance activity saw a slight 6% increase, but the overall refinance share declined to 23% of total volume. With the exception of August and September 2024, refinance levels were still higher than any other month since April 2022.
- Credit quality declines in refinance sector: Average credit scores remained high for purchase loans; however, refinance credit scores, particularly for rate-and-term refinances, saw a drop, with the average score declining by 6 points to 730.
- Home prices trend upward while average loan amounts dip: October saw a second consecutive month of home price increases, with the average purchase price rising from $475.8K to $482.4K. Meanwhile, the average loan amount fell by $3.6K to $380.1K.
The full October 2024 Market Advantage report, which provides more detailed findings and additional insights into U.S. mortgage market trends, can be viewed at (PDF): https://www2.optimalblue.com/wp-content/uploads/2024/11/OB_MarketAdvantage_MortgageDataReport_Oct2024.pdf.
This month’s Market Advantage podcast features Dave Savage, chief innovation officer at TrustEngine and founder of Mortgage Coach, as a guest commentator. The podcast can be accessed at: https://market-advantage.captivate.fm/listen.
About the Market Advantage Report
Optimal Blue issues the Market Advantage mortgage data report each month to provide early insight into U.S. mortgage trends. Leveraging lender rate lock data from the Optimal Blue PPE – the mortgage industry’s most widely used product, pricing, and eligibility engine – the Market Advantage provides a view of early-stage origination activity. Unlike self-reported survey data, mortgage lock data is direct-source data that accurately reflects the in-process loans in lenders’ pipelines.
Nothing herein shall be construed as, nor is Optimal Blue providing, any legal, trading, hedging, or financial advice.
About Optimal Blue
Optimal Blue effectively bridges the primary and secondary mortgage markets to deliver the industry’s only end-to-end capital markets platform. The company helps lenders of all sizes and scopes maximize profitability and operate efficiently so they can help American borrowers achieve the dream of homeownership. Through innovative technology, a network of interconnectivity, rich data insights, and expertise gathered over more than 20 years, Optimal Blue is an experienced partner that, in any market environment, allows lenders to optimize their advantage from pricing accuracy to margin protection, and every step in between. To learn more, visit https://OptimalBlue.com/.
News Source: Optimal Blue
To view the original post, visit: https://www.send2press.com/wire/october-mortgage-lock-data-shows-resilience-and-cracks-in-the-mortgage-market-as-interest-rates-tick-up-65-basis-points/.
This press release was issued by Send2Press® Newswire on behalf of the news source, who is solely responsible for its accuracy. www.send2press.com.
