


The USD/RUB exchange rate has moved sideways in the past few weeks. The pair was trading at 97.28 on Thursday, a few points below the year-to-date high of 102.53. Still, the Russian ruble has crashed by more than 90% from the lowest level in 2022.
Russian economy holding well
The USD/RUB has continued rising in the past few months as concerns about the Russian economy continued. The country’s budget deficit continued rising while dollar supplies in the country dropped because of sanctions.
Recently, however, Russia has had a few tailwinds, which are supporting its recovery. The price of crude oil has jumped by more than 20% from the lowest level in June. Brent was trading at $94 while the West Texas Intermediate (WTI) jumped to $93.20.
Most importantly, Russian urals have remained above the Western-imposed cap. The discount between Brent and Urals has dropped to $17 as it is trading at $77. This means that Russia is still making a fortune selling oil to countries like China and India.
Further, while natural gas has crashed from its highest level in 2022, it has jumped by more than 46% from its lowest level this year. It is also trading at the highest level since August 10th. Therefore, there is a likelihood that Russia is making more money through its exports.
Most importantly, internal data shows that the Russian economy is doing well. For example, the unemployment rate has remained at 3%, lower than America’s 3.6%. Retail sales jumped by 11% in August while industrial production rose by 5.4%.
Business confidence rose to 4.4% as the country boosts its defense spending. Russia is also managing Western sanctions well by pivoting from Western countries to Asian ones.
The challenge for the Russian ruble is that the US dollar index has continued surging amid a hawkish Federal Reserve. The index has jumped to $106.7, the highest level since November last year.
USD/RUB technical analysis
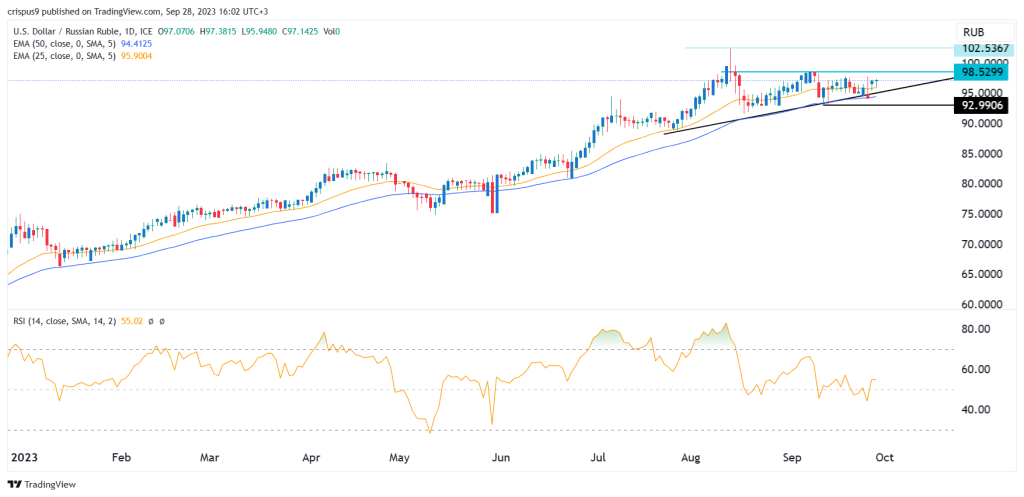
The daily chart shows that the USD to RUB exchange rate has been in a tight range recently. Along the way, the pair has faced substantial resistance at 98.52. It has then formed an ascending triangle pattern. In price action analysis, this pattern is one of the most accurate bullish signs.
The USD/RUB pair has moved above the 25-day and 50-day moving averages. Therefore, the outlook for the pair is bullish, with the next level to watch being at 102.53, the highest point this year.
The flip side is where we interpret the triangle as a triple-top pattern, which is the most popular signs of a reversal. As such, if this is correct, the pair will likely retest the psychological level at 92.99.
The post USD/RUB analysis: This Russian ruble crash is far from over appeared first on Invezz
