


The Invesco QQQ ETF has become one of the best-performing funds in the United States in the past few decades by tracking the Nasdaq 100 index. It has soared from about $40 during its inception and moved to the current $513. While QQQ is a good blue-chip ETF, there is a better alternative to consider known as the Vanguard Infomation Technology (VGT).
What are the QQQ and VGT ETFs?
The Invesco QQQ ETF tracks the Nasdaq 100 index that focuses on the biggest technology companies in the world.
QQQ has a total expense ratio of 0.20% and is one of the most actively traded funds in the market today. It averages about 30 million shares traded daily.
Most companies in the fund are in the technology space, which account for about 60%. The other big categories are consumer discretionary, health care, industrials, telecommuncations, and consumer staples. The common denominator is that all these firms have a technology angle into them.
The biggest companies in the QQQ ETF ae Apple, NVIDIA, Microsoft, Amazon, Broadcom, and Meta Platforms. It has over $324 billion in assets, making it one of the biggest funds in the USA.
The VGT ETF, on the other hand, is a large fund that tracks the top firms in the technology industry. Akey difference with QQQ is that it has more companies. In this, it has 316 companies, while the QQQ fund has just 100.
The top companies in the VGT ETF are Apple, NVIDIA, Microsoft, Broadcom, Salesforce, Oracle, Cisco, and accenture.
Why VGT ETF is a better buy
There are three main reasons why the VGT ETF is a better fund that the QQQ. First, it is a cheaper fund to invest in because it has an expense ratio of 0.09% compared to QQQ that charges 0.20%. This 0.11% spread can make a big difference over time.
For example, assume that you have a $1 million in the two funds. The VGT ETF will cost you $900 a year to maintain. A similar amount with the QQQ will cost you $2,000. This $1,100 difference can go a long way, especially when you are considering holding them for a long time.
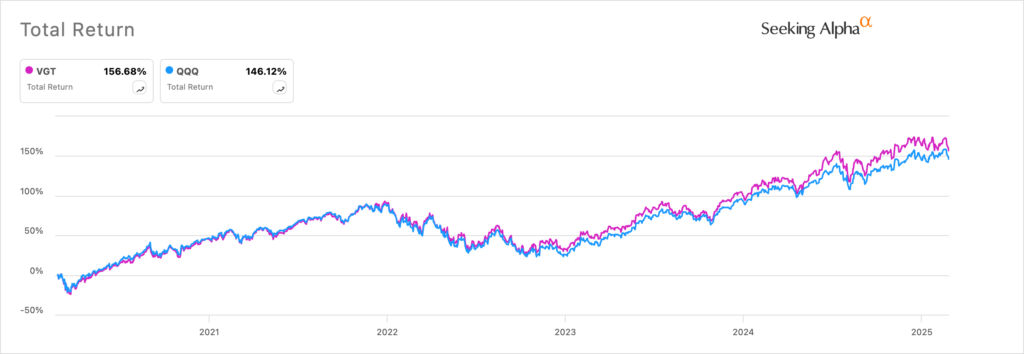
Second, the VGT ETF has a long track record of beating the QQQ fund. Its five-year total return was 156% compared to QQQ’s 146%. The same performance happened in the last three years as the total return was 53% compared to the QQQ’s 51%.
Therefore, while the past performance is not always a good predictor of future gains, there are chances that the VGT fund will keep beaing the QQQ in the future. Also, since the biggest constituents are the same, there is a high likelihood that they will always have a close correlation.
Top catalysts for the Vanguard IT Index Fund ETF
There are two main catalysts that may drive the VGT ETF in the near term. The first one is the upcoming NVIDIA earnings that will provide more information about the health of the AI industry.
There is a general risk among market participants that the AI sector is slowing since companies that have investe huge sums of money are not seeing incremental growth rate. For example, Microsoft is not making a lot of money through its Copilot product that it offers its customers because of its high costs.
The other risk for the AI industry is that DeepSeek has disrupted it by proving that one can build advanced AI models using cheaper chips. Therefore, these earnings will provide more color about the sector.
The VGT ETF will also react to US tariff news, which Donald Trump has already confirmed will happen. These tariffs will likely have an impact on all American companies.
The post Avoid the QQQ ETF, buy this Nasdaq 100 ETF alternative instead appeared first on Invezz
