


London Stock Exchange-listed Hargreaves Lansdown Plc is a fund management company and provides investment advisory services and third-party investment services to the individuals and corporates as well. The group is headquartered in Bristol, the United Kingdom. Its shares are listed on the main market of the London Stock Exchange and a key constituent of the FTSE 100, FTSE All-Share and FTSE 350 indices.
Recently, some media houses reported that Hargreaves chief executive officer Chrill Hill is planning to eschew his bonus worth around £2.1 mn till the time Woodfordâs crisis gets resolved, according to a person familiar with the development.
Hargreavesâs chief has already shown his expression of regret to the investors of Britain's largest investment fund supermarket, which got dragged into the deepening crisis at the Woodford's investment group. Its investors hold around 31% in now-jolted Equity Income Fund at the end of the previous financial year. Woodfordâs Equity Income Fund & Income Focus Fund have been removed by HL (Hargreaves Lansdown) from its Wealth 50 list of recommended funds.
However, the company's official announcement on the Chief's bonus is expected to come today in the public domain, according to some media houses reports. The chief has also initiated an internal investigation to ensure that his company provide advisory in an unbiased manner.
Recently, the chief has also waived off their standard 0.45% fee on any money their investors held with Woodfordâs fund. This strategy was in line with the groupâs effort to cool down their annoyed customers.
However, the UKâs largest fund supermarket is witnessing a humongous number of attacks for its move to readmit Mr Woodfordâs fund into the Wealth 50 at the beginning of this year. At the end of March 2019, Hargreaves investorsâ £10.1 bn investment into Mr Woodfordâs funds were accounted for £2bn only.
Since Mr Woodford barred investors withdrawals from his flagship funds on June 03, this year, Hargreaves has discarded Woodfordâs fund from its âWealth 50â favourite funds lists.
Trading update highlights
Recently, the asset management company reported its trading update for the four months ended on April 30, 2019. In the four months, the group recorded a net new business of £2.9 bn, and on a year-to-date basis, the group's net new business stood at £5.4 bn. As on April 30, 2019, the group's total asset under management stood at £97.8 bn, with a total 1,188,000 active clients. During the period under review, the group acquired around 53,000 net new clients.
Net revenue for the period was £159 mn against £150.6 mn recorded in the same period of the previous financial year. The group has benefited from the higher level of assets under administration and higher cash revenue margin. However, on a year-to-date basis, net revenue surged by 8% to £395.9 mn against £366.6 mn reported in a year-ago period.
In the company filing with the exchange, the chief of Hargreaves said that, despite political and macro-economic related uncertainties, we are confident to deliver attractive growth to our investors.
Stock Information
As on May 18, 2007, shares of the Hargreaves got admitted to the main market of the London Stock Exchange. The group had around 474.32 million outstanding shares, and its market capitalisation of £8.8 bn ranks it among the large-cap companies listed on the London Stock Exchange. The group is a key constituent of several broader indices like FTSE 100, FTSE 350 and FTSE All-Share.
At the current trading level, the dividend yield of the company stood at 1.73 per cent, which was considerably below the benchmark dividend yield. Shares of the Hargreaves carrying a Beta of 1.21x, which indicates the stock is highly volatile than the benchmark index.
1-Yr Price Chart
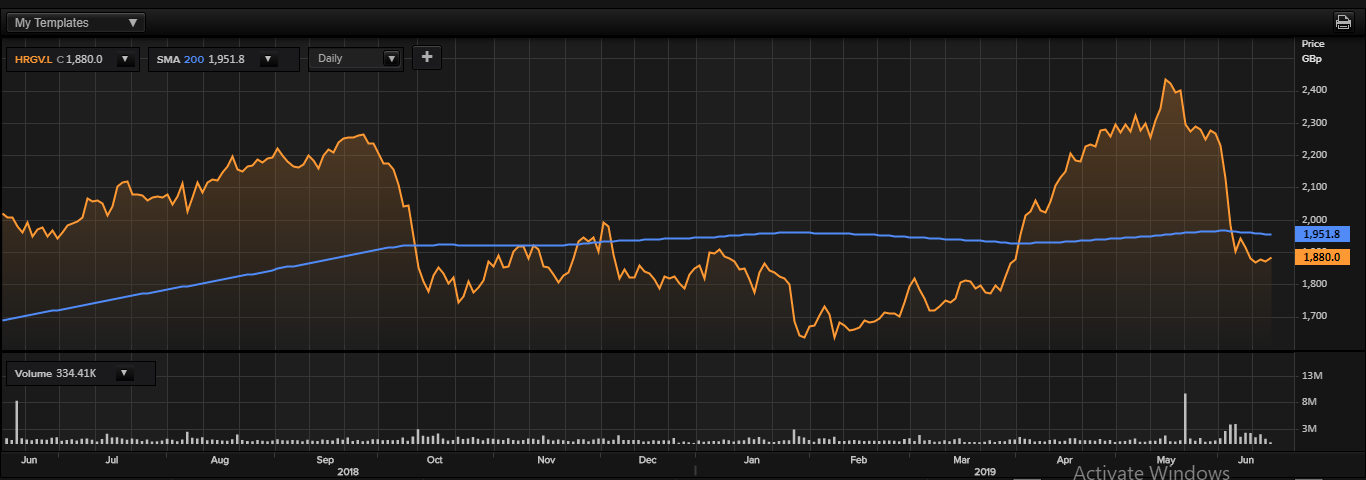
Daily price chart (as on June 17, 2019), before the market close. (Source: Thomson Reuters).
At the time of writing (before the market close, at 12:15 PM GMT), shares of the HL were quoting at GBX 1,880.0 and added 9.5 points or 0.5% in the todayâs market session.
52w High/Low range
In the past 52-wks, shares of the Hargreaves Lansdown have registered a high of GBX 2,447.33 (as on May 16, 2019) and a low of GBX 1,622 (as on Feb 11, 2019) and at the current trading price, as quoted in the price chart, shares were quoting 23.18% below the 52w high price level and 16% above the 52w low price level.
Price Performance (%)
In the past one year, shares have delivered a negative price return of 10.13 per cent, and in the last one month, shares have fallen approximately 19 per cent. However, in the past three months, stock's price return stood at 6.61 per cent.
In the last one year, shares of the Hargreaves ended 128 times up, 120 times down and 4 times unchanged against its respective previous closes. Up/Down ratio in the stock stood at 1.06x. However, in the past one month, shares ended 6 times higher and 14 times lower against its respective previous closing prices. One month, Up/down ratio in the stock stood at 0.44x.
Volume Summary
The 5-day average daily volume in the stock stood at 1,657,206.40, which was around 14% above the 30-day average daily volume of 1,461,026.50, traded at the London Stock Exchange. As price has fallen nearly 4% in the last five trading session, the volume reflects that selling in the stock is high. Todayâs volume in the stock stood at 369,921 (before the market close) with 2,329 trades took place at the LSE.
Simple Moving Average (SMA)
At the current trading level, stock's 5-day, 30-day, 60-day and 200-day SMA stood at GBX 1873.7, 2,179.1, 2,113.2 and 1951.8 respectively, which indicates that, at the current trading level, the stock was trading considerably below the 30-day, 60-day and 200-day SMA prices. This reflects a downtrend in the stock price and near-term recovery in the stock seems to be tough.
Relative Strength Index (RSI)
The 30-day, 14-day and 9-day RSI of the stock stood at 38.48, 25.91 and 19.68 respectively, which indicates, the stock has been entered an oversold zone.
Bollinger Bands®
At the current trading level, the 20-day simple moving average of the stock stood at GBX 2,108.1, the upper band (2x upside deviation from the 20-day SMA) stood at GBX 2,698.1, and lower band (2x downside deviation from the 20-day SMA) stood at GBX 1,518.1. This indicates that the stock is trending towards the lower Bollinger Band®, and this downtrend could prevail until a strong reversal takes place.
52wk PE range
In the past 52wks, shares have traded at a high PE of 47.8 and a low PE 32.10. At the current price level, LTM PE of the stock stood at 36.83. However, this was mainly on account of a steep plunge in the stock price over the past couple of weeks, not because of improvement in the earnings per share.
Therefore, based on the above discussion and unfavourable technical measures, one should take caution before creating a position in the stock at the current trading levels.
