


Pets at Home Group PLC
The United Kingdom-headquartered Pets at Home Group Plc (LON:PETS) is engaged in the business of retailing pet-food, pet products and pet-related services.
PETS-Trading update for Q1 FY20
The company released its trading update for the first quarter of the fiscal year 2020 in August 2019. As the retail revenue picked up and recorded a growth of 8.7 per cent and clocked £266.4 million, the companyâs revenue surged by 9.9 per cent (8 per cent on a like-for like basis) to £303.4 million in Q1 FY20. The companyâs performance was in line with the managementâs expectations, and the board is expecting an underlying profit for the period.
PETS-Business performance for FY19

(Source: London Stock Exchange)
The companyâs revenue surged by 6.9 per cent to £961.0 million in the Financial Year 2019 as against £898.9 million in the Financial Year 2018. The companyâs gross margin (underlying) plunged by 102 basis points to 50.7 per cent in the Financial Year 2019 as against 51.7 per cent in the Financial Year 2018. The companyâs gross margin (statutory) plunged to 46.5 per cent in the Financial Year 2019 as against 51.7 per cent in the Financial Year 2018. The companyâs EBIT (underlying) increased to £93.2 million in the Financial Year 2019 as compared to £88.8 million in the Financial Year 2018. The companyâs net finance expense reduced to £3.5 million for the fiscal year 2019 as against £4.3 million in the fiscal year 2018. The company has proposed a final dividend of 5 pence per share, making the annual dividend to 7.5 pence per share for the fiscal year 2019.
PETS-Share price performance
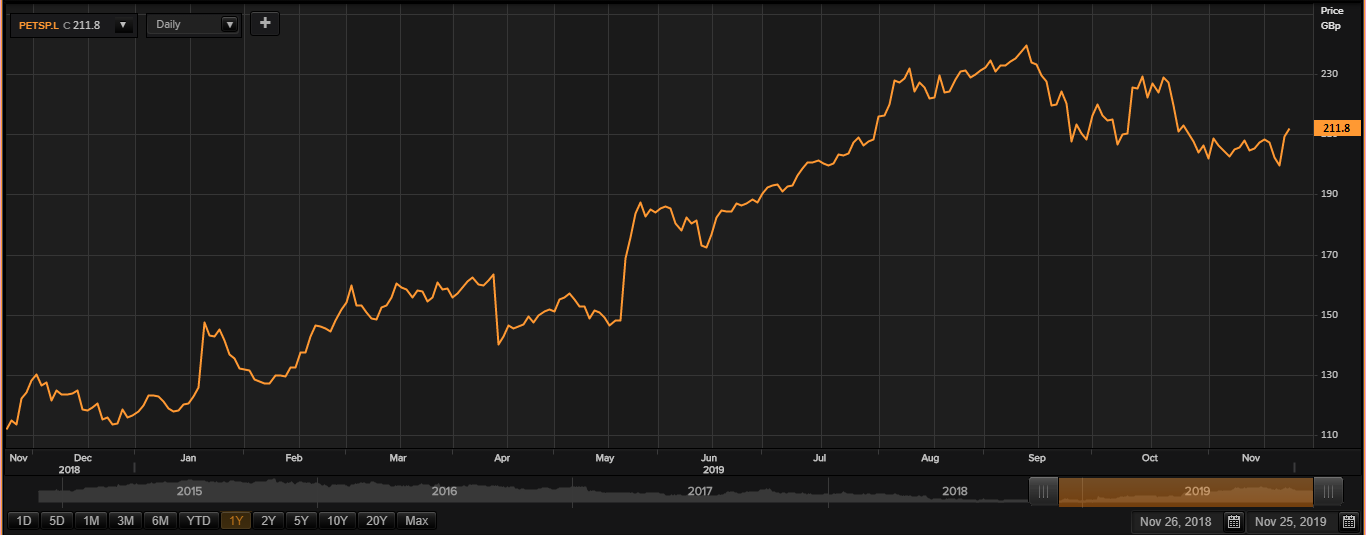
Daily Chart as on 25-November-19, before the market closed (Source: Thomson Reuters)
On 25th September 2019, while writing at 02:36 PM GMT, PETS shares were clocking a current market price of GBX 211.80 per share; which was more by 1.33 per cent in comparison to the last traded price of the previous day. The companyâs market capitalisation was at £1.05 billion at the time of writing.
On 9th September 2019, the shares of PETS have touched a new peak of GBX 242.40 and reached the lowest price level of GBX 108.46 on 27th November 2018 in the last 52 weeks. The companyâs shares were trading at 12.62 per cent lower from the 52-week high price mark and 95.27 per cent higher than the 52-week low price mark at the current trading level as can be seen in the price chart.
The stockâs traded volume was hovering around 515,735 at the time of writing before the market close. The companyâs 5-day stock's daily average traded volume was 1,140,509.20; 30 days daily average traded volume- 925,003.27- and 90-days daily average traded volume â 1,263,003.62. The stock has a dividend yield of 3.59 per cent.
The shares of the company have delivered a negative return of 8.33 per cent in the last quarter. The companyâs stock surged by 80.48 per cent from the start of the year to till date. The companyâs stock has given investors 80.33 per cent of a positive return in the last year.Â
John Wood Group PLC
John Wood Group PLC (LON:WG) is an Aberdeen, Scotland-headquartered group which provides performance-driven project, engineering and technical services to its customers throughout the asset life cycle.
WG-Trading update (released on 7th November 2019)
The company confirmed that the EBITDA 2019 was in accordance with the outlook for FY19, despite slowing down of the macro environment. The company is proactively focusing on cost reduction measures and value creation. The sale of the nuclear business is expected to bring in $305 million and will be closed by first quarter of fiscal year 2020. The company is well poised to grow from the opportunities, emerging trends that it encounters in the market.
WG-Business performance H1 FY19
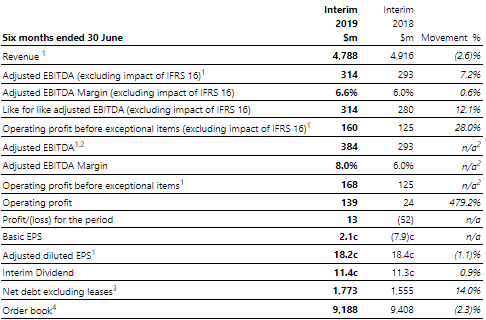
(Source: London Stock Exchange)
The companyâs revenue stood at $4.8 billion in the first half of the fiscal year 2019, due to robust activity levels in Environment and Infrastructure Solutions. The company saw strong growth in EBITDA and operating profit in H1 FY19. Adjusted EBITDA surged by 7 per cent, and operating profit (pre-IFRS 16) excluding exceptional items surged by 28 per cent in H1 FY19, which was in line with managementâs guidance. Due to improved execution, sales mix and cost synergies of $30 million, pre IFRS 16 adjusted EBITDA margin improved to 6.6 per cent. The company has proposed an interim dividend of 11.4 cents for the period.
WG-Share price performance
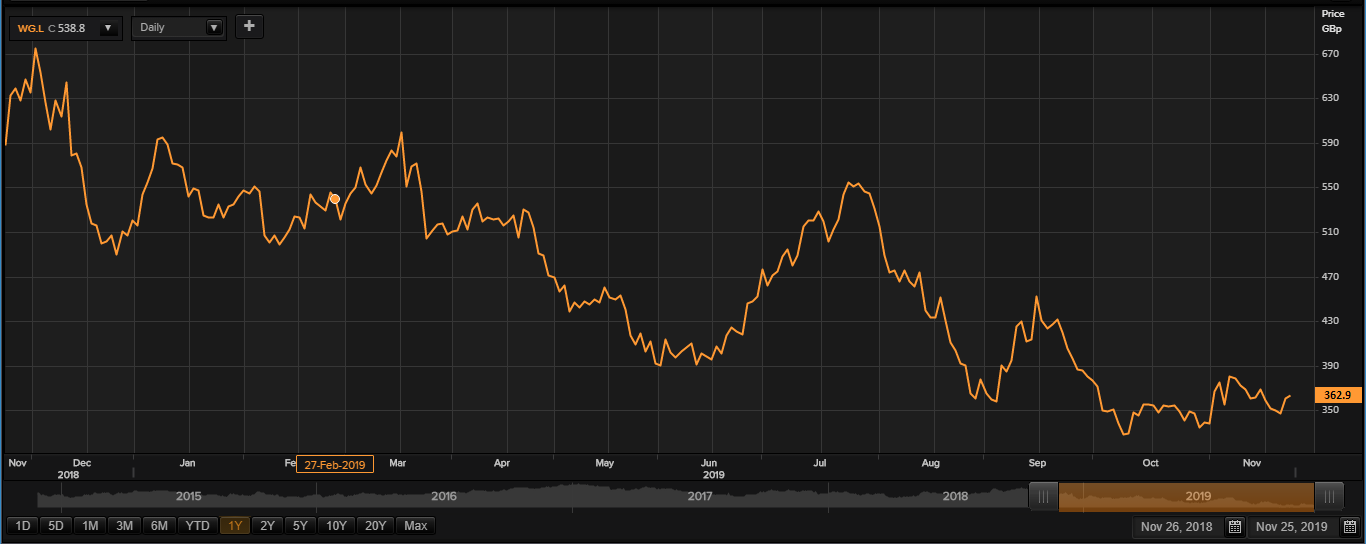
Daily Chart as on 25-November-19, before the market closed (Source: Thomson Reuters)
On 25th September 2019, while writing at 02:41 PM GMT, WG shares were clocking a current market price of GBX 362.90 per share. The companyâs market capitalisation was at £2.46 billion at the time of writing.
On 4th December 2018, the shares of WG have touched a new peak of GBX 685.40 and reached the lowest price level of GBX 322.50 on 31st October 2019 in the last 52 weeks. The companyâs shares were trading at 47.05 per cent lower from the 52-week high price mark and 12.52 per cent higher the 52-week low price mark at the current trading level as can be seen in the price chart.
The stockâs traded volume was hovering around 1,602,686 at the time of writing before the market close. The companyâs 5-day stock's daily average traded volume was 3,198,052.60; 30 days daily average traded volume- 3,116,090.40- and 90-days daily average traded volume â 3,217,251.40. The volatility of the companyâs stock was 28 per cent higher as compared with the index taken as the benchmark, as the beta of the companyâs stock was recorded at 1.28 with a dividend yield of 7.69 per cent.
The shares of the company have delivered a negative return of 10.85 per cent in the last quarter. The companyâs stock plunged by 28.92 per cent from the start of the year to till date. The companyâs stock has given investors 42.40 per cent of a positive return in the last year.Â
Â
SIG PLC
SIG PLC (LON:SHI) is a Sheffield, the UK based supplier of building products. The group is involved in the supply of construction and related market products which are specialist in nature. The companyâs business is differentiated into two segments: UK & Ireland and Mainland Europe.
SHI-Recent news
The company has been experiencing a slump in the construction business across key markets and sensed several factors which suggest a further weakening of the macro-economic scenario, specifically in Germany and the United Kingdom during the year. This slump in business activities has accelerated in recent times, and political and macro-economic uncertainties have continued to rise. To address the continued market weakness, management is taking several actions.
These transformational initiatives are expected to deliver strong results in the second half of the fiscal year 2019.
SHI-Business performance for H1 FY19
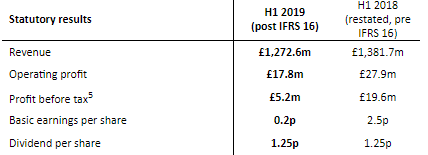
(Source: London Stock Exchange)
On post IFRS 16 basis, the companyâs revenue stood at £1,272.6 million in H1 FY19. The operating profit of the company was £17.8 million in H1 FY19. The companyâs profit before taxation stood at £5.2 million in H1 FY19.
SHI-Share price performance
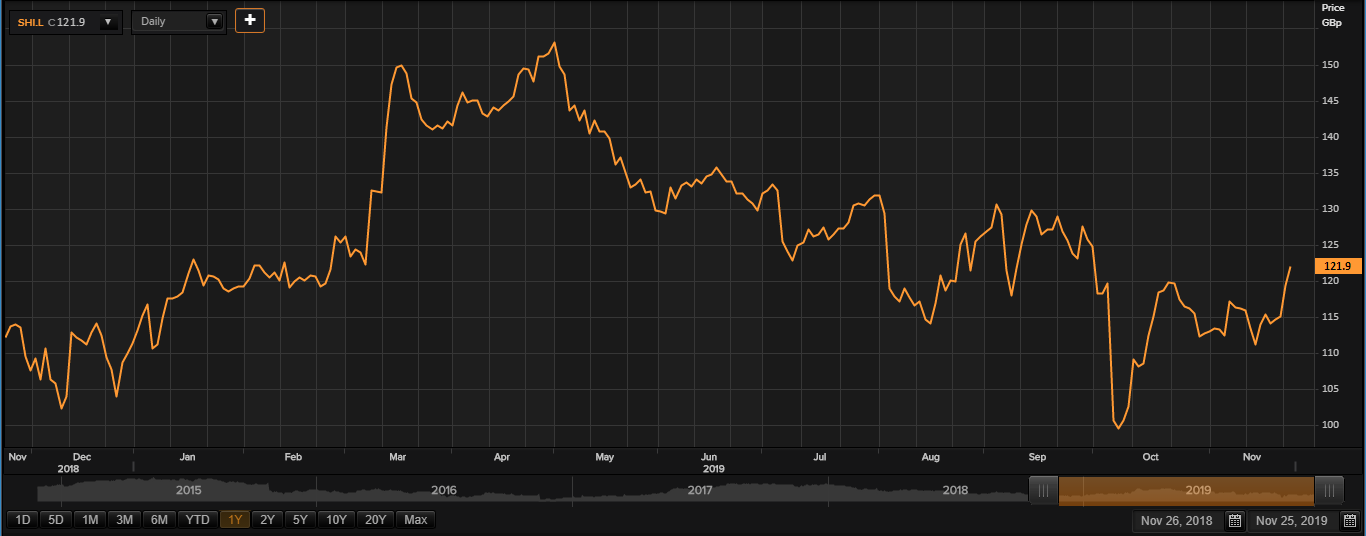
Daily Chart as on 25-November-19, before the market close (Source: Thomson Reuters)
On 25th September 2019, while writing at 02:44 PM GMT, SHI shares were clocking a current market price of GBX 121.90 per share. The companyâs market capitalisation was at £709.70 million at the time of writing.
On 1st May 2019, the shares of SHI have touched a new peak of GBX 154.00 and reached the lowest price level of GBX 87.60 on 07th October 2019 in the last 52 weeks.
The stockâs traded volume was hovering around 26,035 at the time of writing before the market close. The companyâs 5-day stock's daily average traded volume was 7,051.60; 30 days daily average traded volume- 35,769.37- and 90-days daily average traded volume â 54,266.36. The volatility of the companyâs stock was 15 per cent higher as compared with the index taken as the benchmark, as the beta of the companyâs stock was recorded at 1.15 with a dividend yield of 3.15 per cent.
The shares of the company have delivered a negative return of 0.50 per cent in the last quarter. The companyâs stock surged by 8.56 per cent from the start of the year to till date. The companyâs stock has given investors 6.91 per cent of a positive return in the last year.Â
