


CMC Group (CMCX) is amongst the global leader of the online retail financial services provider. They provide comprehensive institutional offerings to their customers. The company empowers their clientele to trade in a wider array of financial securities and products through their highly appreciated advanced trading platform, assisted by sophisticated charts, competitive prices and automated execution. As announced, Grant Foley would be separated from the company on 7th June 2019. Mr Foley, Chief Operating and Financial Officer has been associated with the Group for six years and has now decided to leave the company and explore other opportunities. Euan Marshall will perform duties of interim Chief Financial Officer. He has served the company at senior financial roles for seven years and is currently serving as Group Head of Finance. David Fineberg, who was working previously as Commercial Director for the company, has recently been appointed as Deputy Chief Executive Officer.
Financial Highlights for FY2019 (£, million)
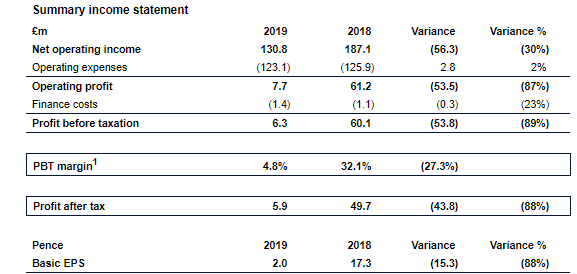
(Source: Annual Report, Companyâs website)
The Net operating income for the FY2019 was down by £56.3 million, nearly 30 per cent to £130.8 million from £187.1 million in the previous year, primarily due to significant decrease in trading volumes from those clients that were affected by the European Securities and Markets Authority (ESMA) regulation, and low levels of market volatility. Furthermore, the Group introduced enhanced checks during the year which contributed to the decline in the acquisition of new clients.
 A lot of emphasis is being laid on cost control this year; due to which operating costs have gone down slightly by £2.8 million (2 per cent) to £123.1 million this year against £125.9 million in FY2018. Profit before tax plunged to £6.3 million this year against £60.1 million in the previous year, reflecting the high level of operating leverage in the business. The Basic EPS declined by 88 per cent to 2 pence in FY2019 from 17.3 pence last year.
 The Cash and cash equivalents declined to £48.7 million this year against £60.5 million in FY2018. However, the company borrowings went down to £1.2 million, which is nearly half the amount from the last year. Furthermore, the companyâs financial position remains strong. The companyâs net liquidity stood at £103.3 million by the year end. Regulatory changes and current market conditions have impacted the profitability in the short-term. The company is making consistent efforts to retain and serve high net-worth clients.
 CMC Markets Plc Share Price Performance
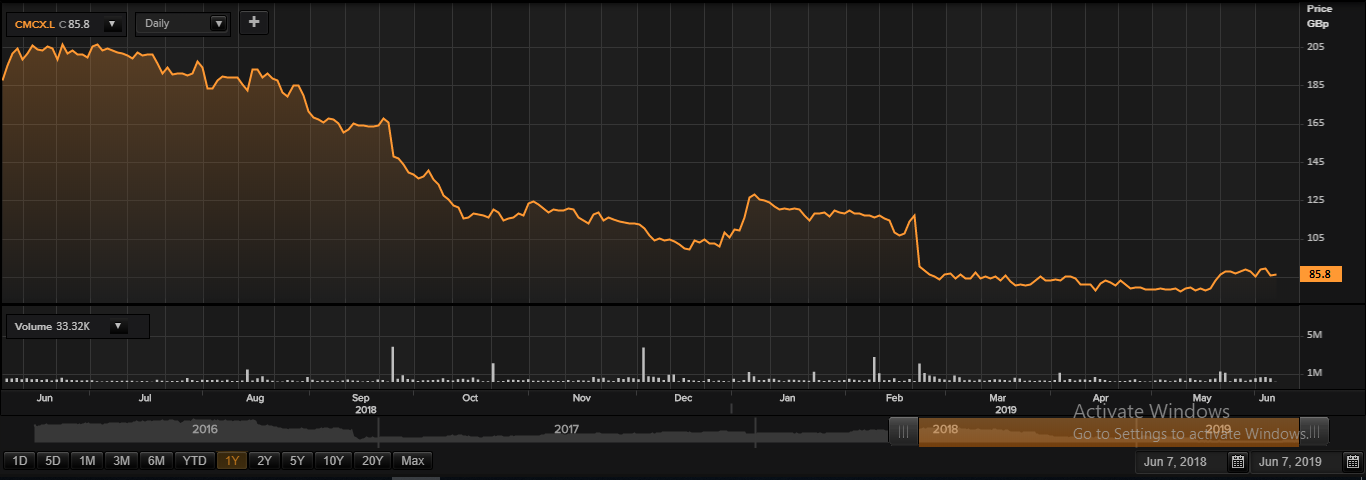
Daily Chart as at June-07-19, before the market close (Source: Thomson Reuters)
On June 7, 2019, at the time of writing (before the market closed, at 09:58 AM GMT), CMC Group shares were trading at GBX 85.8, up by 0.35 per cent against the previous day closing price. Stock's 52 weeks High and Low is GBX 210.00 /GBX 74.30.
At the time of writing, the share was trading 59.14 per cent lower than the 52w High and 15.47 per cent higher than the 52w low. Stock's average traded volume for 5 days was 413,413.60; 30 days â 290,847.87 and 90 days â 327,267.56. The average traded volume for 5 days was up by 42.14 per cent as compared to the 30 days average traded volume. The outstanding market capitalisation was around £246.88 million, with a dividend yield of 2.37 per cent.
