


Ocado Group PLC (LON: OCDO)
Britainâs leading online retailer, online supermarket Ocado.com is a 50:50 joint venture between Marks & Spencer Group Plc and Ocado Group PLC. Â The company has a strong presence across the United Kingdom. The company has three distribution centres where every shopping bag is carefully packed using market-leading technology and software. Bought items are then shipped directly to customers through local delivery partners in bright coloured vehicles. The company delivers more than 55 thousand products, including self-branded products through its popular mobile application. The company brings in innovation in terms of services such as colour-coded bags, it provides digital receipts in date order, sends reminders with the delivery executiveâs name along with flexibility and convenience in terms of getting desired delivery slot with quality customer service on social media handle, email and phone.
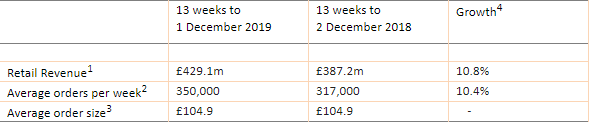
OCDO - Q4 Trading Statement
(Source: Companyâs filings, London Stock Exchange)
The company saw a growth of 10.8 per cent in Retail Revenue, which was in accordance with the managementâs guidance. The group witnessed a surge of 10.4 per cent in orders (average) per week. The companyâs average order size was stable. The company looks forward to adding more M&S lines to the existing range. The company was pleased to report an ever-increasing number of customers in the United Kingdom for Ocado. The company witnessed another strong performance this quarter in terms of customer orders, which means that the company is one of the fastest-growing grocers in the United Kingdom. M&S and Ocado Group collaboration seems to be doing wonders for the company.
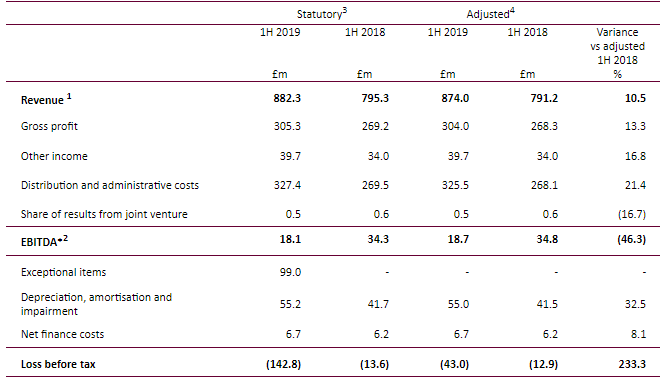
OCDO - Financial Highlights for H1 FY19 for the six-month period ended 2nd June 2019
(Source: Companyâs filings, London Stock Exchange)
The groupâs adjusted revenue increased by 10.5 per cent to GBP 874 million in the first half of the financial year 2019 due to rise in the average number of orders per week, and by additional fees earned from Morrisons. The companyâs adjusted EBITDA plunged by 46.3 per cent to GBP 18.7 million due to a surge in costs incurred in supporting international growth.
The companyâs adjusted loss before taxation stood at GBP 43 million in contrast to a loss of GBP 12.9 million in the first half of the financial year 2018, as a result of rising operational costs and higher share incentive costs during the period. The group has achieved a surge of 9.7 per cent in adjusted retail revenue growth which proves the resilience of the business.
The groupâs new JV (Joint Venture) with M&S shall possibly create further growth opportunities for the company in the United Kingdom and would allow Ocado Group plc to focus on improving its Ocado business solutions using innovation for its partners.
The group is looking forward to improving its global technology-led platform business which could benefit the company in the future.
OCDO - Stock Price Performance
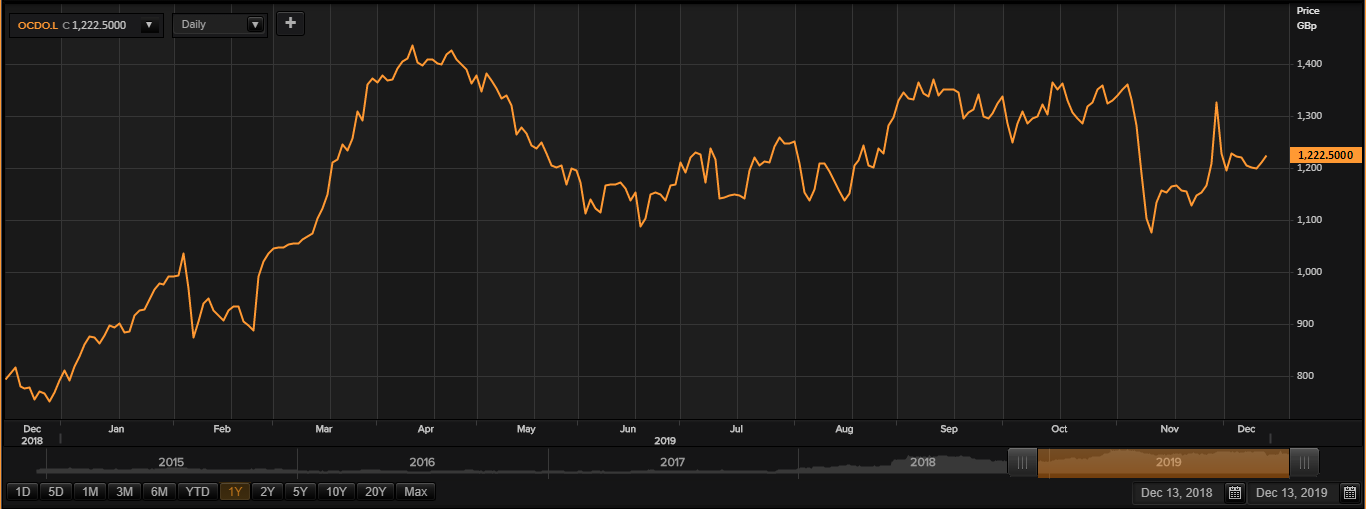
(Source: Thomson Reuters) Daily Chart as on Dec-13-19, before the LSE market close
At the time of writing at 11:57 AM Greenwich Mean Time, on 13th December 2019, the shares of Ocado Group PLC were trading at a current market price of GBX 1,222.50 per share, which were up by 1.03 per cent from the last closing price on the previous day. While writing, the groupâs market capitalisation was approximately £8.47 billion.
The shares of Ocado Group PLC traded at a high-price mark of GBX 1,440.50 on 24th April 2019 and at a low-price mark of GBX 739.70 on 27th December 2018 in the last twelve-month period. The companyâs shares were trading at 65.27 per cent higher than the last twelve-month low-price mark and at 15.13 per cent lower from the last twelve-month high-price mark as can be seen in the price chart at the current trading level.
While writing, the stockâs traded volume stood at 733,764. The stockâs 5-day daily average traded volume of the company was 1,393,121.40; 30 days daily average traded volume- 1,985,752.10 - and 90-days daily average traded volume â 1,508,651.00. The beta of the companyâs stock was recorded at 1.17, which indicates higher volatility with reference to the benchmark index.
The companyâs shares have generated a negative return of 9.60 per cent in the last quarter. From the start of the year to till date, the companyâs stock was up by 53.16 per cent. Since last month, the companyâs stock has given investors a positive return of 12.61 per cent.Â
Hurricane Energy PLC (LON: HUR)
UK based oil and gas company, Hurricane Energy Plc is into the business of oil and gas reserves exploration. The company was developed to extract hydrocarbon resources from naturally fractured reservoirs.
HUR - Operational & Trading update
The company witnessed a strong performance of Lancaster Early Production System; good natural flow rates were achieved with minimal decline in bottom hole pressure. The company got an extension for P1368 licence. The subareas near Lincoln and Lancaster of P1368 will be extended for five years. The sub-areas of Strathmore and Whirlwind are to be relinquished.
The companyâs total production stood at 3.1 million barrels of oil, at a rate of 13,300 bopd as per FY2019 guidance. The company achieved oil sales of 2.8 million barrels from seven cargos. The revenue was recorded at $165 million approximately. The unrestricted cash for Year-end was $150 million approximately.
The company also released guidance for the Financial Year 2020. The average production rate guidance for Lancaster EPS was maintained at 20 thousand bopd.
HUR-Recent developments
The company released the results of testing the 204/30b-4 ("Warwick West") and issued an update on the Lancaster Early Production System ("Lancaster EPS") on 2nd December 2019.
HUR-Financial Highlights for H1 FY19 for the six-month period ended 30th June 2019
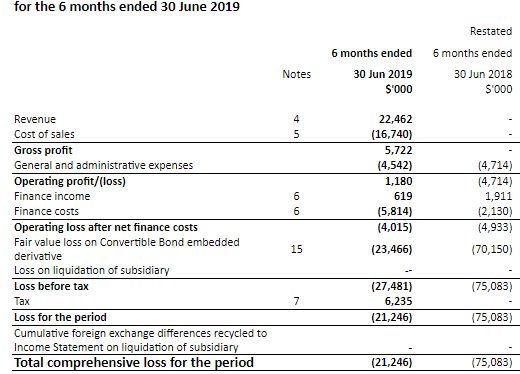
 (Source: London Stock Exchange, Company filings)
The company reported revenue for the first time due to selling of crude oil cargo in the first half of the financial year 2019. As a result, the company generated an operating profit of $1.18 million in contrast to a loss of $4.7 million in the first half of the fiscal year 2018. The groupâs loss post taxation was $21.2 million which included a fair value loss of the convertible Bond amounting to $23.5 million. In the first half of the financial year 2019, the company had cash balances of $81.4 million.
However, there are some principal risks involved in the business of the company. The group requires a significant capital base for its business to run, and failure to raise funds could hamper the growth of the company. In addition, the group has many production-related operational risks which could curtail the operations of the company.
HUR - Stock price performance
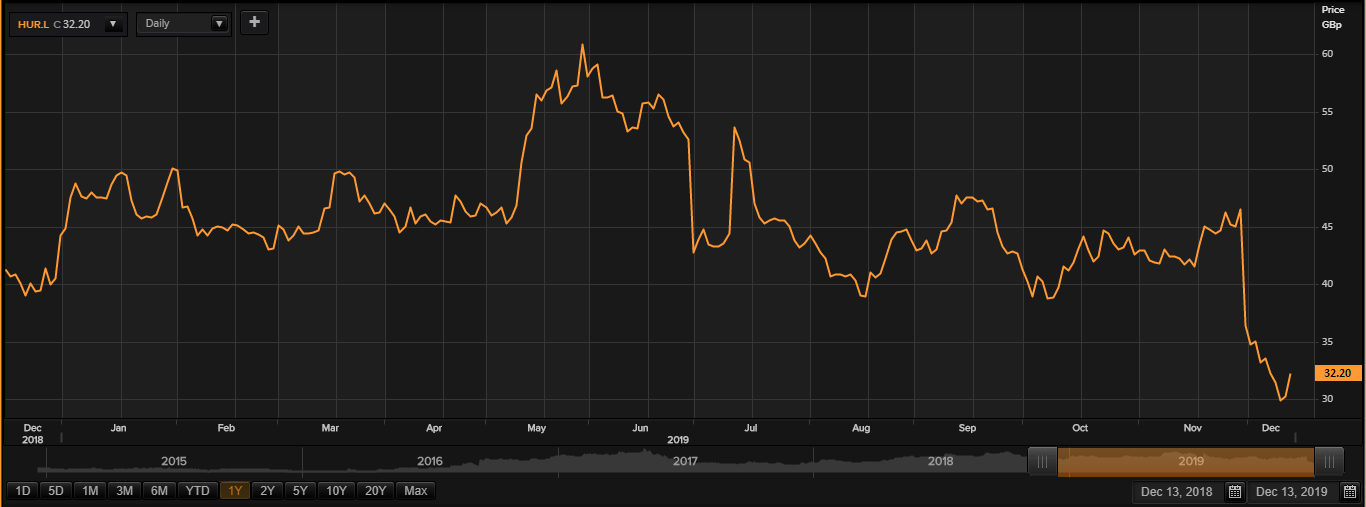
(Source: Thomson Reuters) Daily Chart as on Dec-13-19, before the LSE market close
At the time of writing at 12:02 PM Greenwich Mean Time, on 13th December 2019, the shares of Hurricane Energy PLC were trading at a current market price of GBX 32.20 per share, which were up by 6.62 per cent from the last closing price on the previous day. While writing, the groupâs market capitalisation was approximately £602.46 million.
The shares of Hurricane Energy PLC traded at a high-price mark of GBX 64.70 on 05th June 2019 and at a low-price mark of GBX 28.66 on 12th December 2019 in the last twelve-month period. The companyâs shares were trading at 12.35 per cent higher than the last twelve-month low-price mark and at 50.23 per cent lower from the last twelve-month high-price mark as can be seen in the price chart at the current trading level.
While writing, the stockâs traded volume stood at 18,075,701. The stockâs 5-day daily average traded volume of the company was 18,165,504.00; 30 days daily average traded volume- 13,600,716.47 - and 90-days daily average traded volume â 10,182,422.41. The beta of the companyâs stock was recorded at 1.36, which indicates higher volatility with reference to the benchmark index.
The companyâs shares have generated a negative return of 36.61 per cent in the last quarter. From the start of the year to till date, the companyâs stock was down by 31.61 per cent. Since last month, the companyâs stock has given investors a negative return of 28.74 per cent.Â
