


Evraz Plc
Evraz Plc (LON:EVR) is an Industrial Metal company, having operations in the Czech Republic, Canada, Russian Federation, Italy, Kazakhstan and the USA. The company operates mining activities and is also amongst the top infrastructure steel producer worldwide.
EVR â News Updates
On 31st December 2019, the company announced that it had signed a Amendment Deed in relation to the Long-Term Trans-shipment Agreement between East Metals AG, a fully owned subsidiary of the company and Nakhodka Trade Sea Port previously concluded as a part of the disposal of Nakhodka Port in May 2017.
On 2nd December 2019, EVRAZ announced the selection of Deborah Gudgeon as director (non-executive) of Highland Gold Mining Ltd.
EVR â Trading Update (Q3 FY2019)
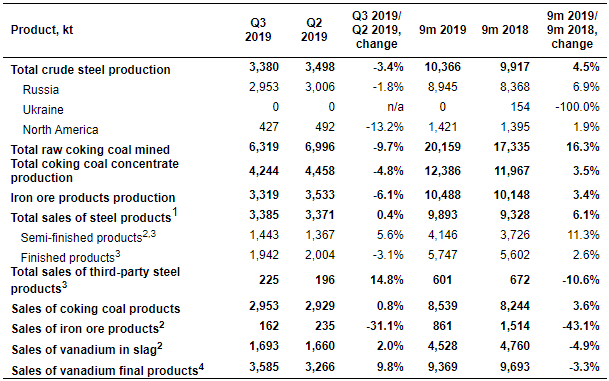
(Source: Companyâs filings, London Stock Exchange)
In Q3 FY2019, the companyâs combined crude steel declined by 3.4 per cent versus Q2 FY2019. Output was impacted due to capital repairs and lower volumes at EVRAZ ZSMK. The sales of total steel products remained flat for the period. The company saw a rise in semi-finished products sales by 5.6 per cent in Q3 FY2019 as against Q2 FY2019. The coking coal products external sales remained flat on a quarter on quarter basis. The vanadium products sales surged by 9.8 per cent in Q3 FY2019 versus Q2 FY2019, due to increased demand in China.
EVRâ Stock price performance
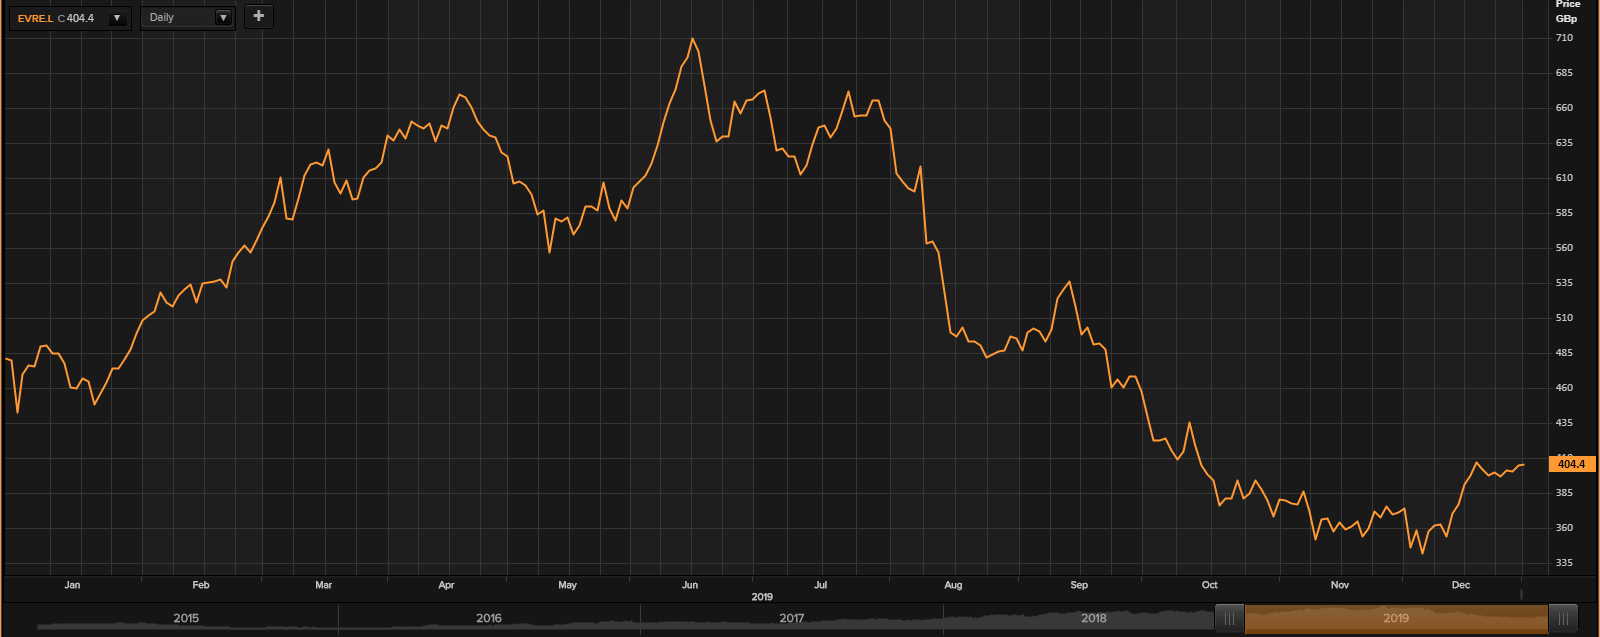
Daily Chart as on 2nd January 2020, before the market closed (Source: Thomson Reuters)
On January 2nd, 2020, Evraz Plc shares were trading at GBX 404.4 at the time of writing before the market close (at 1:20 PM GMT), up by 0.25 per cent against the last day closing price. Stock's 52 weeks High and Low are GBX 710.20/GBX 339.19. The stock price has delivered negative 15.5 per cent return in the last one year, and negative 4.10 per cent return in the last three months.
The company made its 52-week high of GBX 710.20 on 17th June 2019 and made its 52-week low of GBX 339.19 on 5th December 2019.
The average volume of the Evraz Plc shares is 1.87 million, and it has a market cap of GBP 5.87 billion.
Total outstanding shares of the Evraz Plc are 1.45 billion.
The beta of the Evraz Plcâs stock was reported to be at 2.12. It implies that the stock price movement of the company is more volatile, in comparison to the benchmark market indexâs movement.
JD Sports Fashion Plc
JD Sports Fashion Plc (LON:JD) is a Bury, United Kingdom-headquartered General Retailers company, which provides casual wear and sportswear using online and offline modes. The company has its operations in 19 territories globally with more than 700 stores.
JD â News Updates
On 2nd January 2020, the company confirmed that as a corporate governance review measures, initial engagement with some of the company's major shareholders had taken place and their views on a wide range of corporate governance issues have been obtained. This engagement would continue during the first quarter of 2020, and it is the Board's intention to use the findings from this exercise to assist in the preparation of the company's Annual Report for the 52-week period to 1 February 2020. The company would formally present a new remuneration policy in its Annual Report this year, which would be put to shareholders for approval at the company's AGM in Summer 2020.
On 19th December 2019, the company announced that it would be publishing its post- Christmas trading statement on Friday 10 January 2020.
JD â Financial Highlights for H1 Financial year 2020
In the first half of the financial year 2020, the groupâs revenue surged by 47 per cent to £2,721.2 million as against £1,846.3 million reported in the H1 FY2019, driven by 12 per cent Like-for-like sales growth in its global Sports Fashion fascias. The companyâs gross margin declined by 1.3 per cent to 46.9 per cent in H1 FY2020 from 48.2 per cent in H1 FY2019. The companyâs proforma headline profit before tax, including exceptional items (under IAS 17 âLeasesâ) stood at £166.2 million for the period. The companyâs adjusted earnings per share were up by 25.1 per cent from 10.05 pence in H1 FY2019 to 12.57 pence in H1 FY2020. The net cash balance at the end of the period stood at £118.1 million (2018: net debt of £85.1 million) with the additional substantial investments on both acquisitions, including Footasylum, and capital expenditure being funded by the ongoing strong cash generation in the core retail fascias. The company proposed an interim dividend per share of 0.28 pence, a surge of 3.7% against the previous year (2018: 0.27 pence).
JDâ Stock price performance
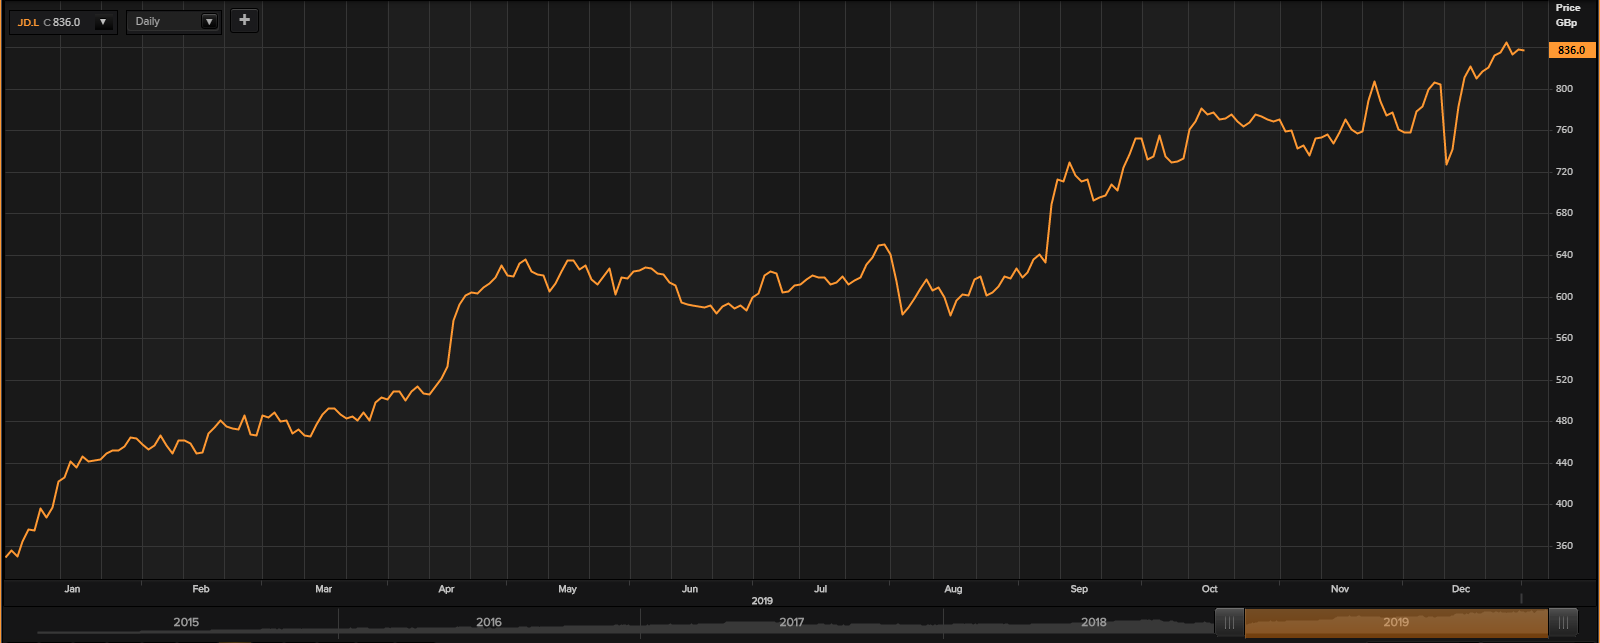
Daily Chart as on 2nd January 2020, before the market closed (Source: Thomson Reuters)
On January 2nd, 2020, JD Sports Fashion Plc shares were trading at GBX 836 at the time of writing before the market close (at 12:50 PM GMT), down by 0.17 per cent against the last day closing price. Stock's 52 weeks High and Low are GBX 849.80/GBX 337.60. The stock price has delivered 135.22 per cent return in the last one year, and 13.83 per cent return in the last three months.
The company made its 52-week high of GBX 849.80 on 30th December 2019 and made its 52-week low of GBX 337.60 on 3rd January 2019.
The average volume of the JD Sports Fashion Plc shares is 1.53 million, and it has a market cap of GBP 8.15 billion.
Total outstanding shares of the JD Sports Fashion Plc are 973.23 million.
The beta of the JD Sports Fashion Plc stock was reported to be at 0.8378. It implies that the stock price movement of the company is less volatile, in comparison to the benchmark market indexâs movement.
Unilever Plc
Unilever Plc (LON:ULVR) is a global company selling fast-moving consumer goods. The company is engaged in the production and marketing of a variety of products from different categories such as home care, food, health, beverages and wellbeing. The company has divided its operations into three reportable segments being Foods & Refreshment, Home Care and Beauty & Personal Care.
ULVR â News Updates
On 17th December 2019, the company announced its sales update. It expected underlying sales growth for 2019 to be slightly below its 3-5% multi-year range guidance. It was due to challenging markets, an economic slowdown in South Asia, and difficult trading conditions in West Africa. The companyâs expected earnings, margin and cash would not be impacted.
ULVR â Trading Update (Q3 FY2019)
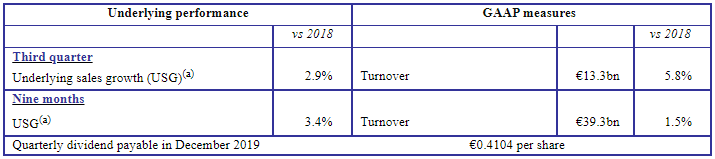
(Source: Companyâs filings, London Stock Exchange)
During the third quarter of the financial year 2019, the companyâs underlying sales growth was 2.9 per cent with 1.4 per cent from volume and 1.5 per cent from price as compared to the same period in FY2018 due to continued growth in emerging market and home care segment. Emerging markets grew at 5.1 per cent with strong growth across South East Asia. Due to slowdown in demand, growth in India remained competitive. In Latin America, Brazil, the company grew modestly due to the intense competition. Turnover increased by 5.8 per cent in the third quarter of FY2019 against the same period in FY2018 due to sales growth, acquisitions, and a positive currency impact. Underlying sales in Beauty & Personal Care segment, Home Care segment and Foods & Refreshment segment grew by 2.8 per cent, 5.4 per cent, and 1.7 per cent respectively. The company declared a dividend of GBP 0.3576 for the third quarter of the fiscal year 2019.
ULVR â Stock price performance
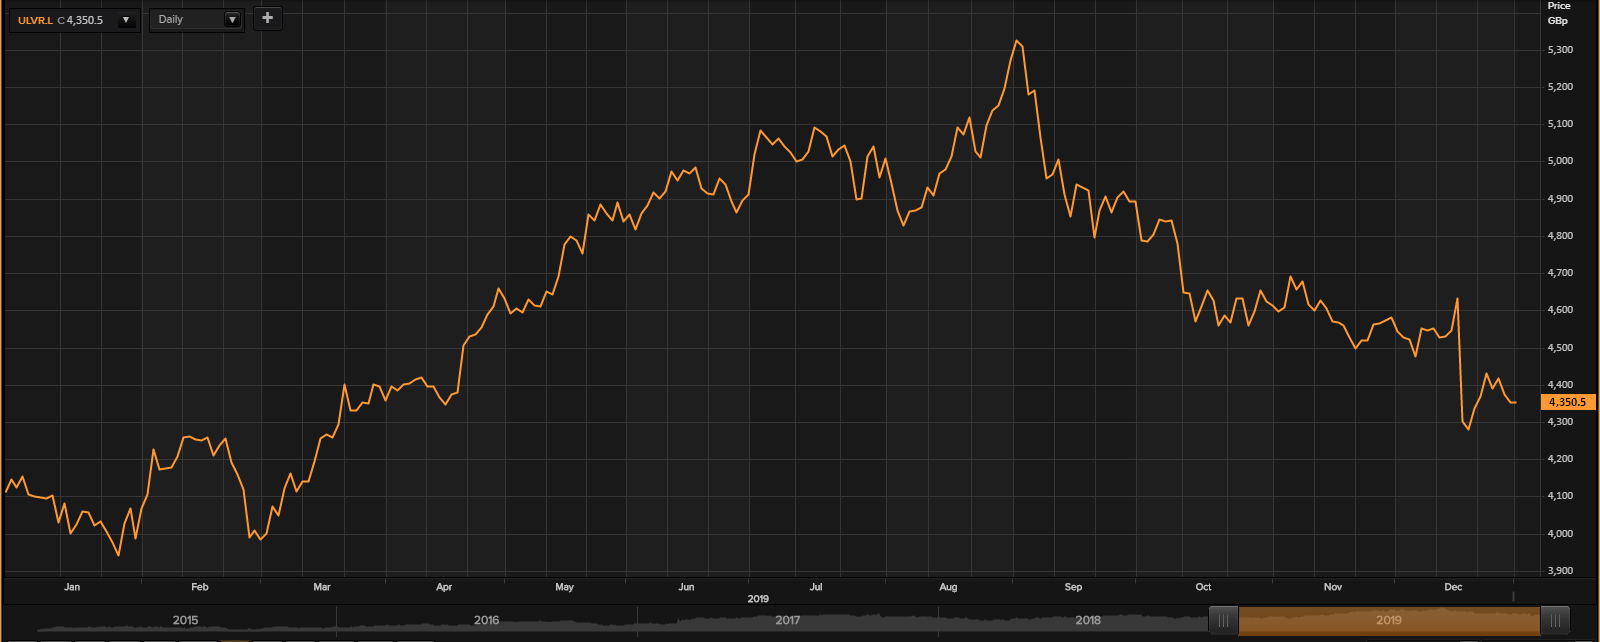
Daily Chart as on 2nd January 2020, before the market closed (Source: Thomson Reuters)
On January 2nd, 2020, Unilever Plc shares were trading at GBX 4,350.50 at the time of writing before the market close (at 2:05 PM GMT), with no change against the last day closing price. Stock's 52 weeks High and Low are GBX 5,333/GBX 3,904.94. The stock price has delivered 4.96 per cent return in the last one year, and a negative 9.1 per cent return in the last three months.
The company made its 52-week high of GBX 5,333 on 4th September 2019 and made its 52-week low of GBX 3,904.94 on 31st January 2019.
The average volume of the Unilever Plc shares is 2.19 million, and it has a market cap of GBP 114.03 billion.
Total outstanding shares of the Unilever Plc are 2.63 billion.
The beta of the Unilever Plc stock was reported to be at 0.6494. It implies that the stock price movement of the company is less volatile, in comparison to the benchmark market indexâs movement.
