


Highlights
- FYI Resources Limited (ASX:FYI) shares have been rallying over the last two trading sessions.
- On Tuesday, the company announced its plans to enter the rare earths sector.
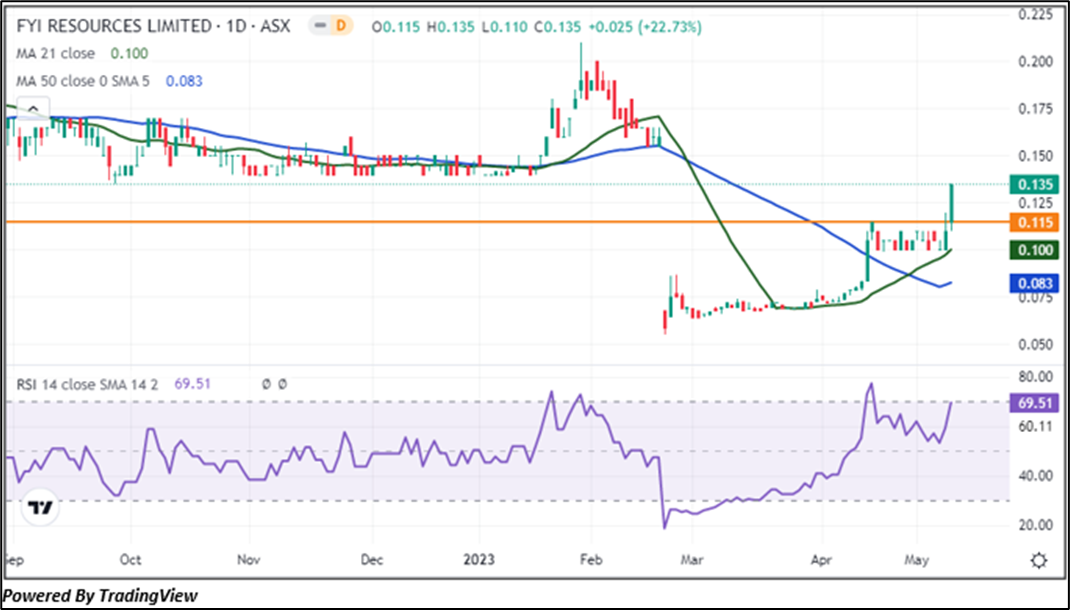
- On the daily chart, FYI shares have taken support from a horizontal trendline and surpassed the 21-period SMA.
FYI Resources Limited (ASX:FYI) shares have been rallying over the last two trading sessions after coming out of a trading halt on 8 May 2023. Today (10 May 2023) FYI shares closed 22.72% higher at AUD 0.135. Today's gains in the stock came on top of yesterday's 10% rally. In the last two trading sessions, shares of this resources company have rallied 35%.
The stock came on the radar of market participants after the company announced its plans to make an entry into the rare earths sector after signing an agreement for the staged acquisition of Minhub Operations Pty Ltd (MOPL), which has separately entered into a non-binding co-operation agreement with Arafura Rare Earths Limited (ASX:ARU) to explore the joint development of the Minhub Mineral Sands Processing facility in the northern territory of Australia.
As per the agreement, Arafura will have the first right of offtake for the neodymium (Nd) and praseodymium (Pr) rich monazite and heavy rare earth rich xenotime concentrate from the Minhub Project. Also, Arafura and MOPL will jointly investigate further downstream development options for separated heavy rare earths, including dysprosium (Dy) and terbium (Tb).
FYI Resources said MOPL has the technical expertise required for the project and has well-developed existing relationships with upstream concentrate suppliers and other stakeholders, which FYI can leverage to create a project that will provide downstream value-add and help develop a rare earths supply chain in Australia to service local and global needs.
Given these developments at the company's end, will FYI shares rally further. Let's study the FYI price chart to know this stock's near-term price outlook.
FYI’s Technical Analysis:
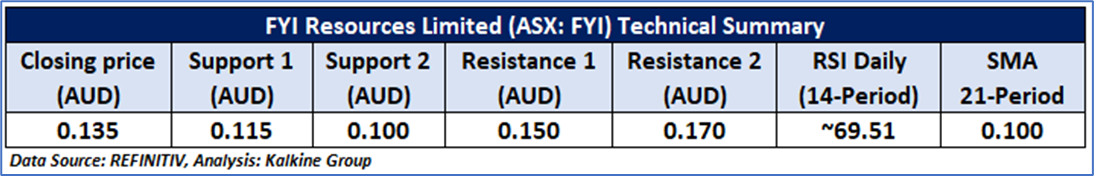
FYI share price started to move upside after taking the support from a horizontal trendline and recently surpassed the 21-period SMA, indicating the possibility of further upside movement hereon. Furthermore, RSI (14-period) is moving northward with a reading of 69.51, supporting a positive bias. Important support for the stock is positioned at AUD 0.100, while key resistance is placed at AUD 0.170.
Daily Technical Chart – FYI
The technical levels for the stock were evaluated as per the closing price of AUD 0.135 per share as on 10 May 2023.
Disclosure: FYI Resources Limited (Company) is a client of Kalkine Media Pty Ltd (Kalkine Media), an affiliate of Kalkine. However, under no circumstances have Kalkine or its related entities been, directly or indirectly influenced in making any related insights concerning company as contained in this report, and no form of compensation is or will be received by Kalkine, Kalkine Media or Kalkine's other related entities for the publication of this report.
Note 1: Past performance is neither an Indicator nor a guarantee of future performance.
Technical Indicators Defined:
Support: A level at which the stock prices tend to find support if they are falling, and a downtrend may take a pause backed by demand or buying interest. Support 1 refers to the nearby support level for the stock, and if the price breaches the level, then Support 2 may act as the crucial support level for the stock.
Resistance: A level at which the stock prices tend to find resistance when they are rising, and an uptrend may take a pause due to profit booking or selling interest. Resistance 1 refers to the nearby resistance level for the stock and if the price surpasses the level, then Resistance 2 may act as the crucial resistance level for the stock.
Stop-loss: It is a level to protect further losses in case of unfavourable movement in the stock prices.
The Green colour line reflects the 21-period moving average. SMA helps to identify existing price trends. If the prices are trading above the 21-period, prices are currently in a bullish trend (Vice – Versa).
The Blue colour line reflects the 50-period moving average. SMA helps to identify existing price trends. If the prices are trading above the 50-period, prices are currently in a bullish trend (Vice – Versa).
The Orange/ Yellow colour line represents the Trendline.
The Purple colour line in the chart’s lower segment reflects the Relative Strength Index (14-Period), which indicates price momentum and signals momentum in trend. A reading of 70 or above suggests overbought status, while a reading of 30 or below suggests an oversold status.
Disclaimer
This article has been prepared by Kalkine Media, echoed on the website kalkinemedia.com/au and associated pages, based on the information obtained and collated from the subscription reports prepared by Kalkine Pty. Ltd. [ABN 34 154 808 312; AFSL no. 425376] on Kalkine.com.au (and associated pages). The principal purpose of the content is to provide factual information only for educational purposes. None of the content in this article, including any news, quotes, information, data, text, reports, ratings, opinions, images, photos, graphics, graphs, charts, animations, and video is or is intended to be, advisory in nature. The content does not contain or imply any recommendation or opinion intended to influence your financial decisions, including but not limited to, in respect of any particular security, transaction, or investment strategy, and must not be relied upon by you as such. The content is provided without any express or implied warranties of any kind. Kalkine Media, and its related bodies corporate, agents, and employees (Kalkine Group) cannot and do not warrant the accuracy, completeness, timeliness, merchantability, or fitness for a particular purpose of the content or the website, and to the extent permitted by law, Kalkine Group hereby disclaims any and all such express or implied warranties. Kalkine Group shall NOT be held liable for any investment or trading losses you may incur by using the information shared on our website.
