


Crude oil prices are noticing a sudden upside rush as tension in middle east simmers. Apart from the middle east tension, the increasing conflict between the United States and Iran is pulling the crude oil prices.
The prices of Brent Oil Futures (CFD Derived) have improved significantly from the level of US$59.57 (Dayâs low on 12th June 2019) to the level of US$65.76 (Dayâs high on 21st June 2019), which in turn, marks a gain of more than 10 per cent in few trading sessions.
Likewise, the prices of WTI Crude (CFD Derived) inched up from the level of US$50.72 (Dayâs low on 12th June) to the level of US$57.98 (Dayâs high on 21st June), a gain of more than 14 per cent.
However, the prices are getting pulled by the events in the global economy rather than the demand and supply dynamics, and investors should pay close attention to the fundamentals of the oil market along with the global events.
Crude Oil Market Dynamics:
The United States Inventory Scenario:
The United States Crude Oil Inventory has dropped from its May-ending value of 6.771M to -3.106M in June, for the week ended 14th June 2019, which in turn, supported the Crude oil prices in the short-term.
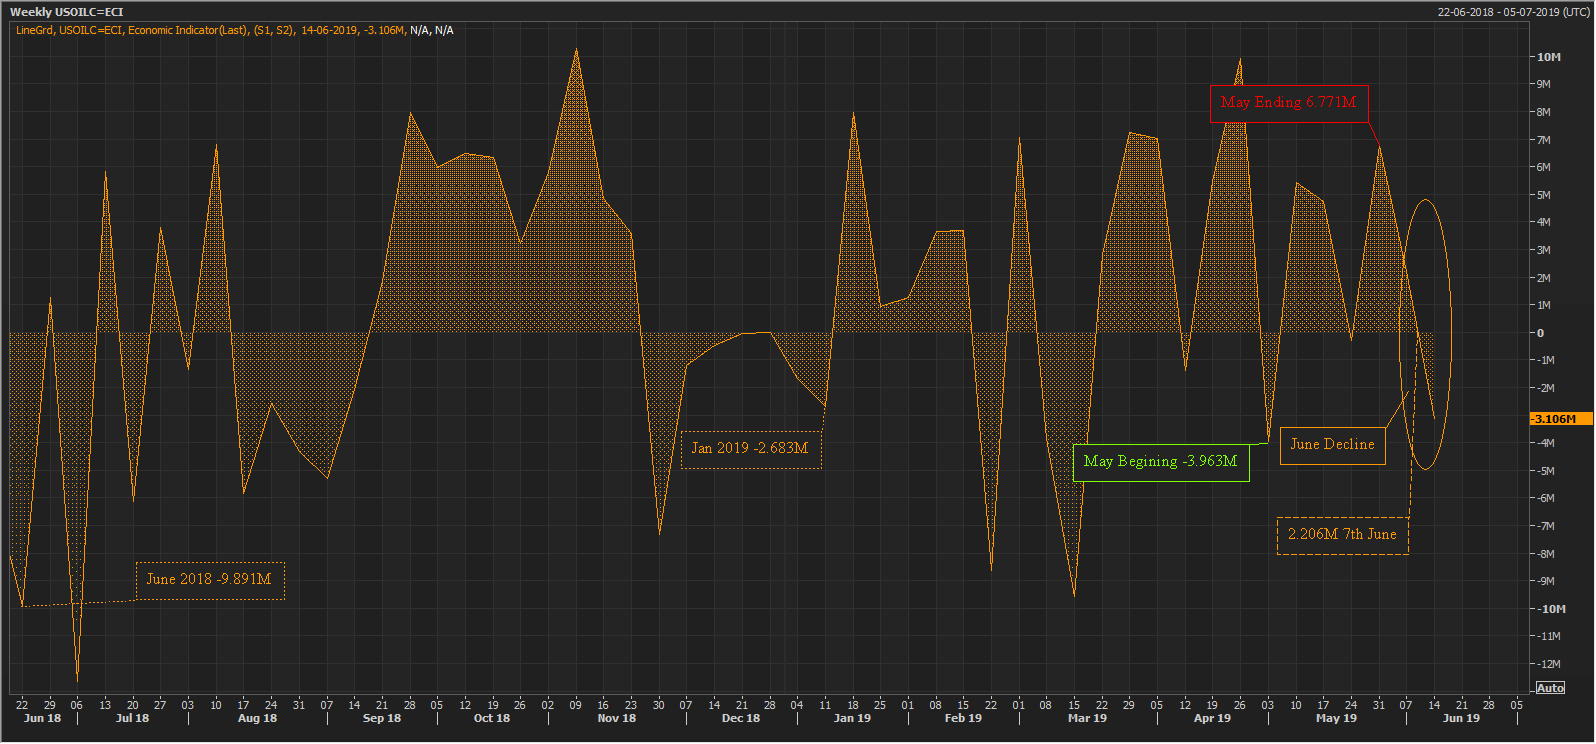
U.S. Weekly Crude Inventory (Source: Thomson Reuters)
However, over the long-term, the Crude Oil Inventory in the United States inched up from its June 2018 level of -9.891M. The overall yearly build-up in the crude stockpiles suggests increased domestic production.
The YTD inventory also inched up in May; however, it again slid back below the January 2019 low of -2.683M.
The overall long-term build up in the Inventory level is decreasing the United States crude reliance on the OPEC cartel, which could hamper the market scenario, as the United States is one of the top OPEC oil consumers.
OPEC import in the United States:
As per the data from the Energy Information Administration (EIA), the United States import from OPEC members stood at 1.5 million barrels a day in March 2019, which was lowest since March 1986. The overall decline in import volumes is due to the increase in the United States domestic production.
The data from the EIA further suggests that the U.S. import from Venezuela and Iraq decreased the most in the first three months of the present year. In 2018, 20 per cent or 505,000 barrels per day, of the total OPEC import in the U.S. was from Venezuela, which stood at just 47,000 barrels per day in March 2019, amid the U.S. sanctions on the oil exporting country.
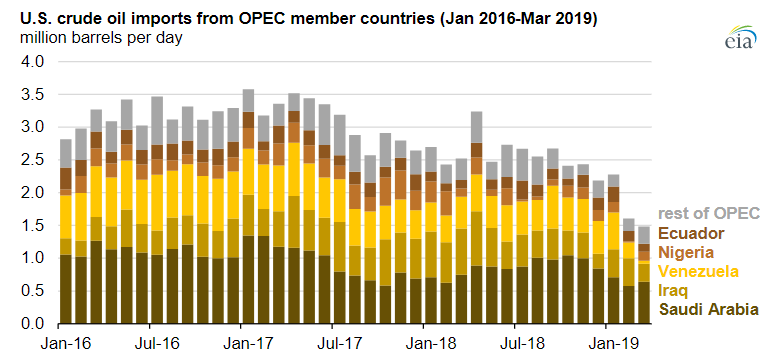
Source: EIA
The United States reduced the import from Saudi Arabia and Iraq over the voluntary production cut by the cartel members, and as per the data, the import in the U.S. from both the OPEC members in March averaged 26 per cent and 28 per cent below their 2018 average levels.
Source: EIA
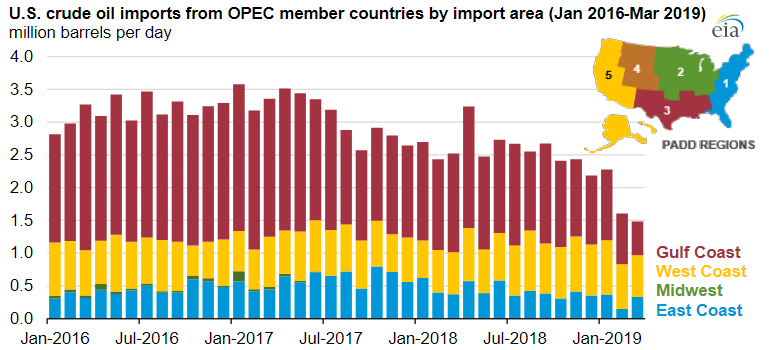
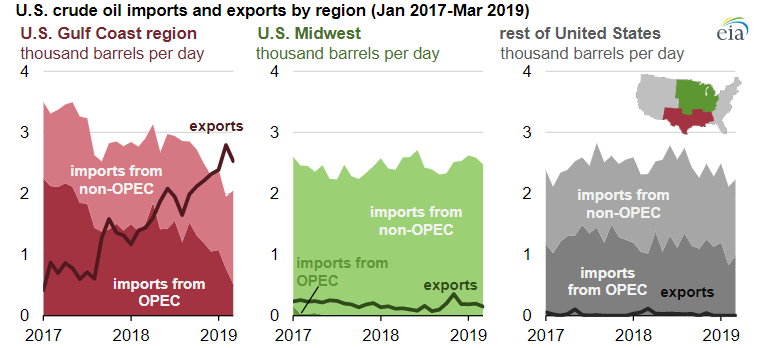
The region wise import and export dynamics in the United States suggests that the Gulf Coast Region, which is one of the highest oil producing region, reduced the imports from OPEC and non-OPEC members, and increased the overall exports.
Source: EIA
In a nutshell, the United States is reducing its oil import from the OPEC members amid high domestic production, and the higher domestic production in the United States is making the nation capable of exporting the oil in the market.
The production decision by the OPEC members in the upcoming meeting would be crucial for the market, and it would further decide the overall global production scenario.
Drill Productivity:
The overall inch up in domestic production in the United States is mainly due to the increase in drill productivity. As per the data, the top oil-producing region of the U.S. reached the level of 8,450 thousand oil barrels per day, which is further estimated by the EIA to reach the level of 8,520 thousand barrels per day in July 2019.
Source: EIA
The well oil production is also inching up in the United States, which is further adding to the production strength of the country.
Source: EIA
OPEC Oil Production:

OPEC Oil Survey (Source: Thomson Reuters)
OPEC members have kept the production in a narrow range so far to support the crude oil prices in the international market; however, in the recent sanctions on Iran and Venezuela could prompt the cartel to inch up the production to fill the supply gap.
The OPEC members are set to meet in early July 2019, where the EIA expects that the consortium could decide to increase the production amid production loss from Iran and Venezuela and high price channelized by the OPEC members to reduce the economic growth dependency on the high crude oil prices.
So, in a nutshell, the United States domestic production is filling the local demand and OEPC is keeping the output steady for now, but the consortium is expected to increase it progressively.
Why Inventories are Low in the U.S.?
Refinery Capacity:
Despite an increase in domestic production, the U.S. Crude Oil Inventory has witnessed a drop amid higher domestic consumption. As per the data, the crude oil refinery inputs averaged up by 200,000 barrels a day from the previous week on 14th June 2019 and stood at 17.3 million barrels per day. The refineries operating capacity stood at 93.9 per cent of the operable capacity.
Apart from the higher inputs in the petroleum sector, the United States crude oil import for the week ended on 14th June 2019 averaged at 7.5 million barrels a day, down by 144,000 barrels per day as compared to the previous week.
The import averaged at 7.5 million barrels a day over the past four weeks, which in turn, marked a decline of 7.6 per cent from the same corresponding period.
The overall increase in the petroleum inputs along with the decline in import decreased the weekly inventories by 3.1 million barrels for the week ended 14th June 2019.
However, the total Crude Oil Inventory in the United States stood at 482.4 million barrels, which are about 7 per cent higher than the five-year average for this time of year.
The high inventory in the United States could now enter the international market, and investors should analyse the demand scenario as compared to the overall production scenario presented above.
In a nutshell, the decline in inventory seems to be more strategic rather than demand-driven, and investors should keep a close watch over the counter and factor the further development carefully.
Event Responsible for Pulling Crude Up:
Following the global cues, the market witnessed an increase in middle east tension. Post the reports of an attack on oil tankers emerged, the middle east noticed further attacks on the Gulf of Oman. The United States blamed Iran for the attack, which in turn, escalated tension between Iran and the United States.
Recently, the Iran security members shot down a United States surveillance drone citing that the drone entered near the Iranian crosslines. The United States media houses mentioned that the United States called-off an air-strike on Iran.
The news further got a massive response from Iran, which further quoted that Iran is ready for war if it emerges. The overall escalation in the middle east tensions coupled with the furious situation between the United States and Iran created a supply tension in the market, which pulled the crude oil prices up.
In a tweet yesterday, the U.S. president Donald Trump mentioned he did not call-off the air-strike, but he prevented it, which could further heat up the issues. Apart from that, the United States president said that Washington would impose further sanctions on Iran on Monday (24th June 2019), which in turn, added to the gains as the tension continues to rise.
Crude Oil on Charts:
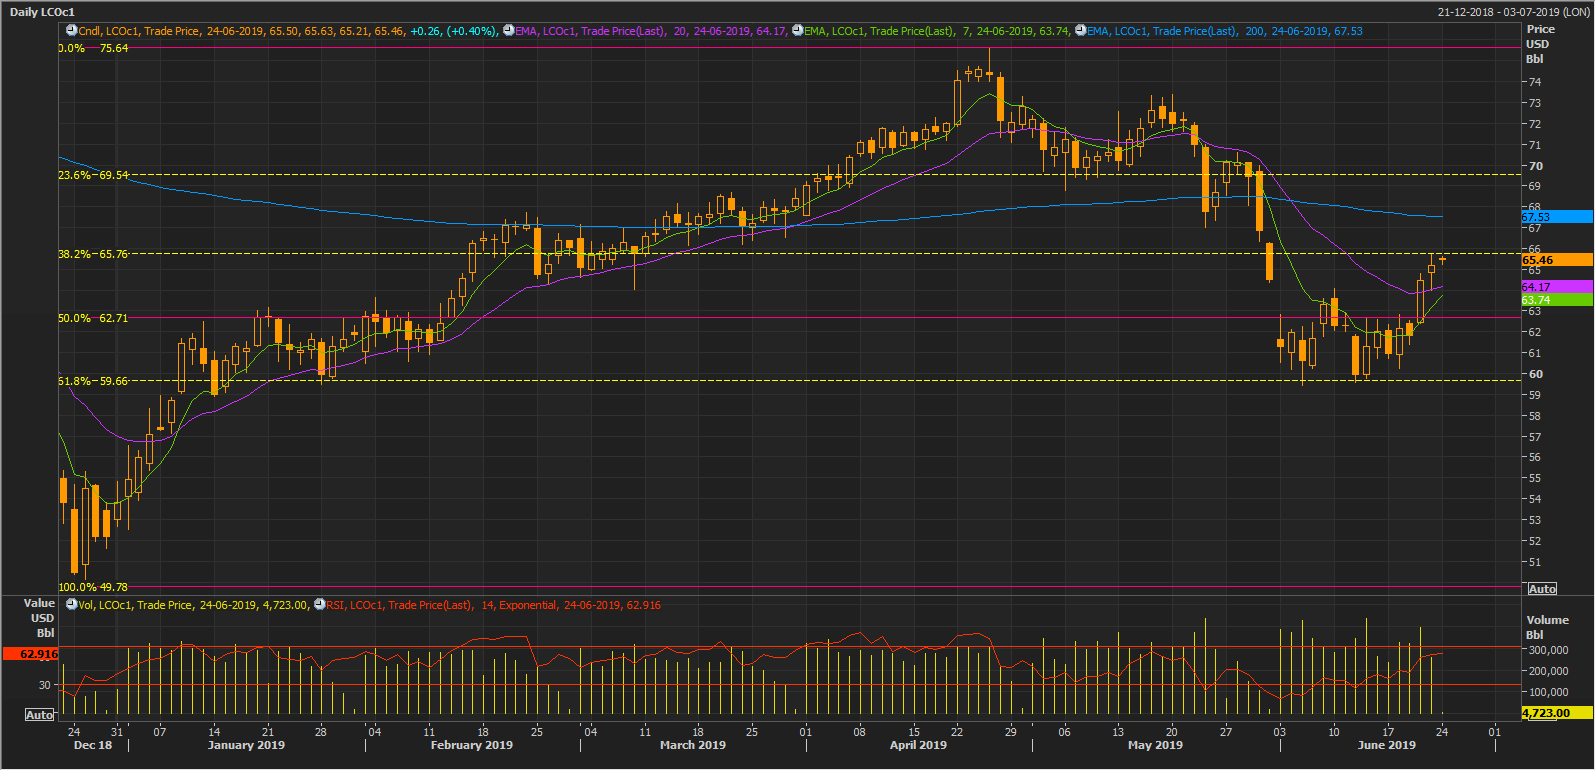
LCO Daily Chart (Source: Thomson Reuters)
On a daily chart, the width between the 7-days and 20-days exponential moving averages is reducing, and if crude oil keeps its black shine up, these averages could give a possible Golden Cross (bullish signal). However, the prices are currently trading below the 200-days exponential moving average, which is at US$67.53, which could provide resistance.
The prices retraced back after retracing 51.8 per cent of the rally which started from the level of approx. US$49.78.
Over the volume counter, the previous bull run was supported from the rise in volumes; however, the volume on 21st June 2019 is higher than the previous day, which further suggests a speculative entry in the market.
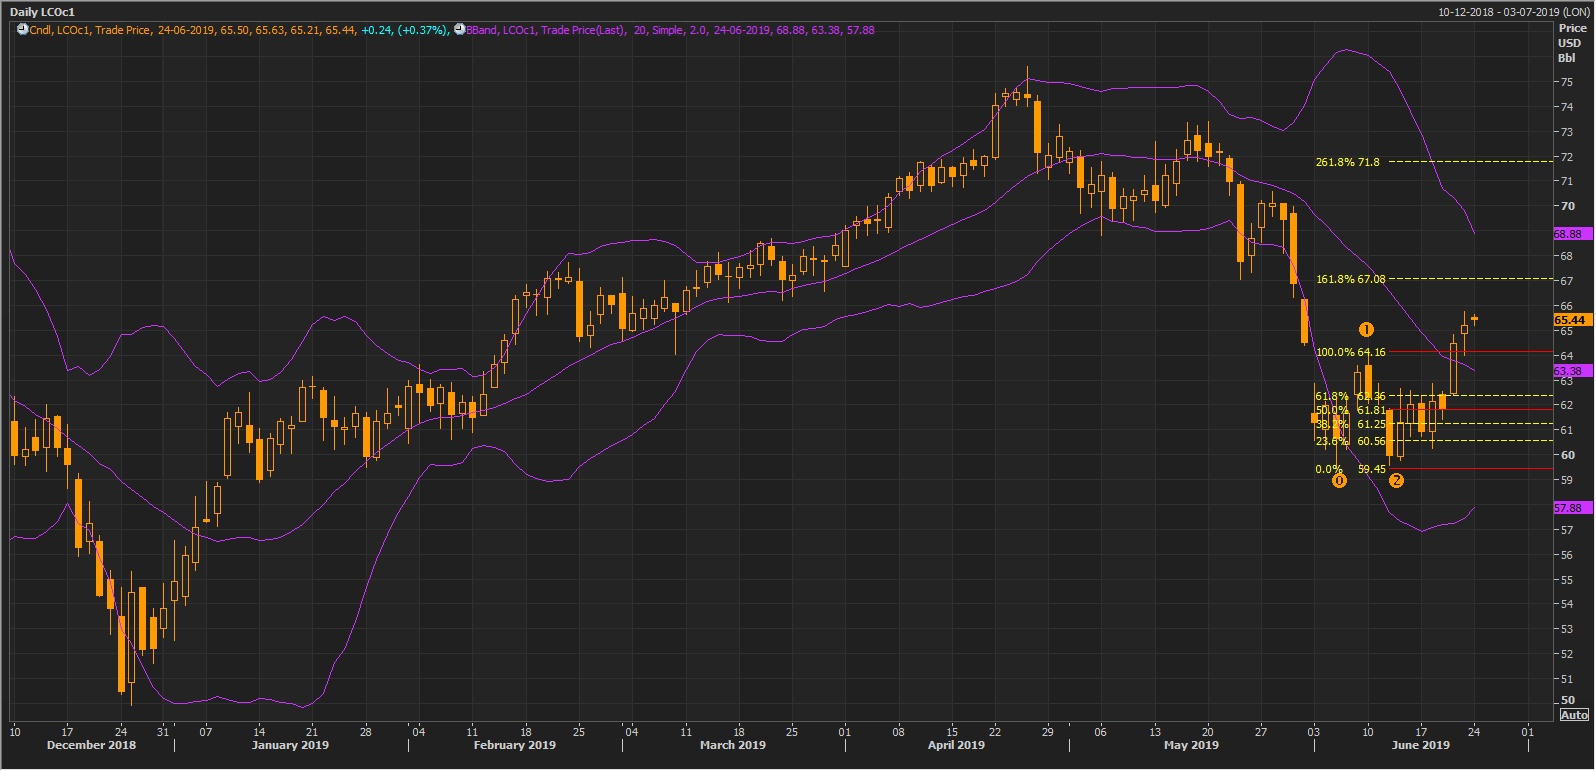
LCO Daily Chart (Source: Thomson Reuters)
The prices breached the level of 100.0 per cent Fibonacci Series, projected from the level marked as 0,1,2 on the chart shown above. The prices recently breached the 20-days simple moving average median of the Bollinger band. The upper the lower bands are distanced significantly, which in turn, denotes high volatility in the crude oil prices.
Disclaimer
This website is a service of Kalkine Media Pty. Ltd. A.C.N. 629 651 672. The website has been prepared for informational purposes only and is not intended to be used as a complete source of information on any particular company. Kalkine Media does not in any way endorse or recommend individuals, products or services that may be discussed on this site. Our publications are NOT a solicitation or recommendation to buy, sell or hold. We are neither licensed nor qualified to provide investment advice.
