


In this article, we discuss three stocks from the health care sector in Australia. These stocks are recognised in the benchmark - S&P/ASX 200 index along with the S&P/ASX 200 Health Care (Sector) index. Besides, the market capitalisation of each of these three stocks is over A$1 billion.
The signs of entering into the later stage of the business cycle are quite noticeable. Globally, the interest rates are coming down, which also depicts that the level of the existed stimulus was inefficient to complement the growth. Therefore, the cutting of rates represents the persisting slowdown in an economy.
More importantly, the revenues of the health care industry are tied to basic necessities of humans, which would continue to remain resilient across cycles, and the sector is economically less sensitive. Speaking of Australia, Healius Limited (ASX: HLS) has acknowledged the growing & ageing population. Subsequently, these kinds of structural changes provide an edge over the rest countries, particularly to Australia.
Meanwhile, Nanosonics Limited (ASX: NAN) had declared decent results during the half-year disclosure in February. Further, CLINUVEL PHARMACEUTICALS LTD (ASX: CUV), despite operating only in Europe, has disclosed very strong cash flows in the latest Appendix 4C â Quarterly in July.
One of the systematic risks to the financials of the companies remains the adoption of AASB 16 on leases, which would impact the reporting structure, and ultimately the profits of the company. It is worth noting that the developments of such standards are one-time exercises, which would remain consistent post the initial implementation.
Considering the performance of the S&P/ASX 200 Health Care (Sector), the index has returned +21.07% over the year-to-date period. On 16 August 2019, S&P/ASX 200 Health Care (Sector) closed at 34,833.22, up by 123.9 points or 0.36%. Concurrently, the benchmark S&P/ASX 200 closed at 6,405.5, down by 2.6 points or 0.041%.
Let us now take a look at the three health care stocks as follows:
Healius Limited (ASX: HLS)
On 16 August 2019, the company released full-year results for the period ended 30 June 2019. Accordingly, the company delivered reported revenues of $1,810.3 million in FY19 compared with $1,704.6 million in FY18. Besides, the company declared a lower final dividend compared with the interim dividend.
Reportedly, the company incurred costs of $49.9 million in restructuring and strategic initiatives, which makes up the difference between reported EBIT of $117.4 million & underlying EBIT of $167.3 during the FY19. Besides, last year, the company incurred costs of $46 million in restructuring and strategic initiatives along with an impairment of $49.5 million.
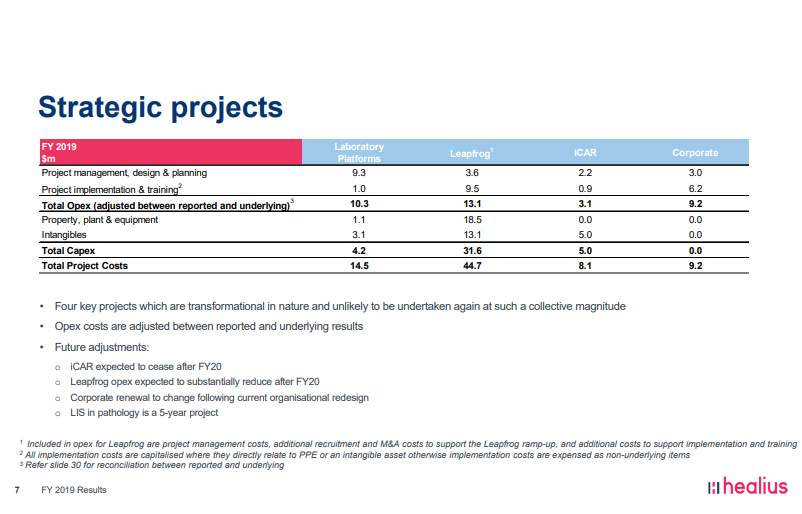
Strategic Projects (Source: HLS FY 2019 Results Presentation)
Subsequently, the companyâs reported profit for the year was $55.9 million in FY19 against a restated profit of $4.1 million in FY18. Further, the EPS for the year was 9.2 cents in FY19 compared with 0.8 cents in FY18.
As per the release, the company declared a fully-franked dividend of 3.4 cents per share, down from the previous dividend (interim) of 3.8 cents per share for FY19 period. The company has delivered a full-year dividend of 7.2 cents per share.
Besides, the dividends represent a pay-out ratio of 60% of reported net profit for the year, and the company expects to remain at this level until the completion of the current investment phase. Meanwhile, the final dividend is payable on 27 September 2019, the ex-date for the dividend is 29 August 2019, and the record date is 30 August 2019.
Outlook
Reportedly, the company expects underlying NPAT for FY2020 to be higher than FY2019, which might be impacted by market conditions, implementation of AASB 16 on leases. The long-term drivers in the country remain resilient for healthcare backed by growing & ageing population, escalating patientsâ expectations, expanding wealth per capita, and rising number of people with chronic illness.
Meanwhile, the regulatory environment appears stable in the near-term with an expected increase in healthcare costs, funding pressures would persist upon the private sector, and diversified revenues, sustaining lean cost structures would underpin the growth.
Besides, the company has been undertaking strategic initiatives and organisational redesign to deliver clinical excellence, simple consumer?friendly access, and cost-efficiency in a community setting. Further, these strategies would support consumer wellbeing, disease prevention and early intervention to allow resilient healthcare in the country.
On 16 August 2019, HLSâ stock last traded at A$2.93, up by 5.018% from the previous close. The stock of the company gave a return of 14.34% over the year-to-date period. The market capitalisation of the stock stands at ~A$1.74 billion, with ~622.74 million shares outstanding.
Nanosonics Limited (ASX: NAN)
Nanosonics released the full-year results for the previous year on 20 August 2018. The full-year results for the current year are expected shortly. The company is engaged in developing products for infection prevention, and its flagship device, trophon® serves many healthcare needs across the globe. Now, the company is also plying trade with its next flagship device, trophon®2.
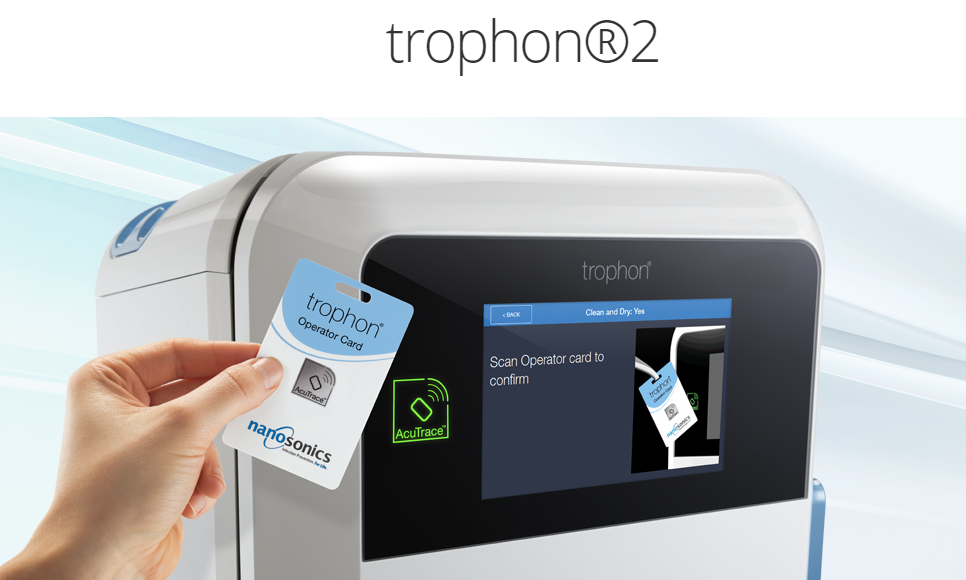
trophon®2 (Source: Companyâs Website)
In February 2019, the company released results for the half-year ended 31 December 2018. Accordingly, the company had declared stellar results for the period, and the revenues reached ~$40.7 million in H1 FY19 compared with ~$30 million in H1 FY18. Besides, the company reported a total comprehensive income of ~$6.25 million in H1 FY19 against ~$2.19 million in H1 FY18, and basic EPS was 2.37 cents in H1 FY19 compared with 0.74 cents in the H1 FY18.
The balance sheet at the half-year was carrying relatively low borrowings of 302k down from 522k, under non-current liabilities. Besides, the accumulated losses were down to ~$23.95 million as at 31 December 2018 from ~$31.47 million in the prior six-month end on 30 June 2018.
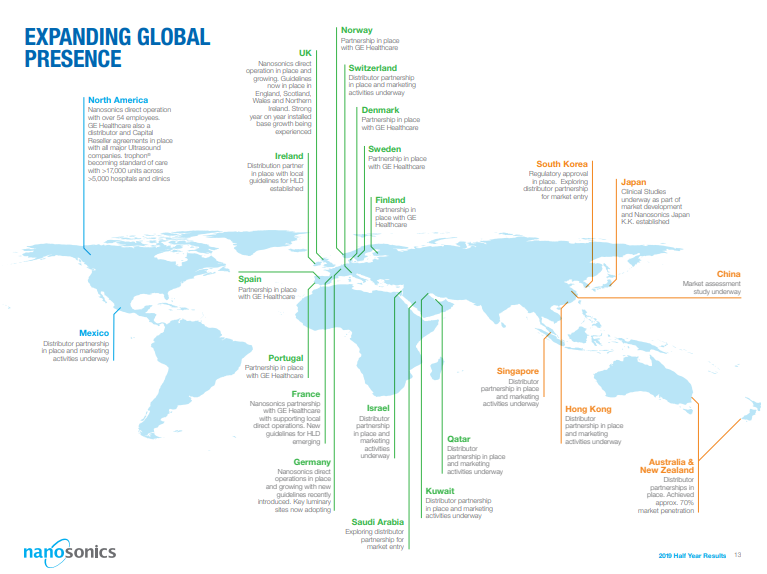
Expansion (Source: NANâs 2019 Half Year Financial Results Investor Presentation, February 2019)
During April 2019, the company reported on a major development occurred in France related to intermediate-level disinfection, which is an equivalent of high-level disinfection, and these developments support the growth plans of the business. Interestingly, the companyâs presence in France allows it to deliver the highest standards of automated ultrasound probe disinfection, and ultimately, the highest level of patient protection.
In July, the company appointed Mr Geoff Wilson as a Non-executive Director of the company. Subsequently, Mr Wilson was appointed as the Chair of Audit and Risk Committee, and he brings in an experience of over 37 years to the board.
On 16 August 2019, NANâs stock last traded at A$4.83, down by 1.227% from the previous close. The stock has provided a return of 75.90% over the year-to-date period. The market capitalisation of the company stands at ~A$1.47 billion, with ~299.97 million shares outstanding.
CLINUVEL PHARMACEUTICALS LTD (ASX: CUV)
The company traces its roots back to 1987 with an idea of synthesising human hormones to protect the skin. In 2001, the company came into existence following two decades of testing the SCENESSE®.
Subsequently, the company achieved a breakthrough in the year 2014 when the European Medical Agency approved SCENESSE® - the first systematic drug providing protection to the entire skin surface without exposure to light & UV.
Besides, the company has been working with the US FDA to launch the product in the US, and a new drug application was submitted in June 2018.
On 31 July 2019, the company released Appendix 4C â quarterly report for the period ending 30 June 2019. Accordingly, the cash receipts for the quarter stood at $13.01 million, up by 121% from the previous quarter of $5.9 million. Besides, the total cash receipts for the year end to June 2019 stood at $32.22 million up by 36% from the prior corresponding period.
Reportedly, the company receives cash from the provision of SCENESSE®. During winter, the unit order is generally lower due to the lower density of ambient light, which impacts the demand during the winter season. Contrarywise, the demand soars up during the summer season due to stronger ambient light impacting the cash flows positively during June & September quarters.
Meanwhile, the net cash from operations for the year end to 30 June 2019 were positive ~$18.38 million against a positive ~$11.69 million in the previous corresponding period. Besides, the forex movements also favoured the company and impacted positively by ~$718k to the cash balance by the end of the quarter. Consequently, the cash balance of the company was ~$54.27 million as at 30 June 2019 compared with a cash balance of ~$36.2 million as of 30 June 2018.
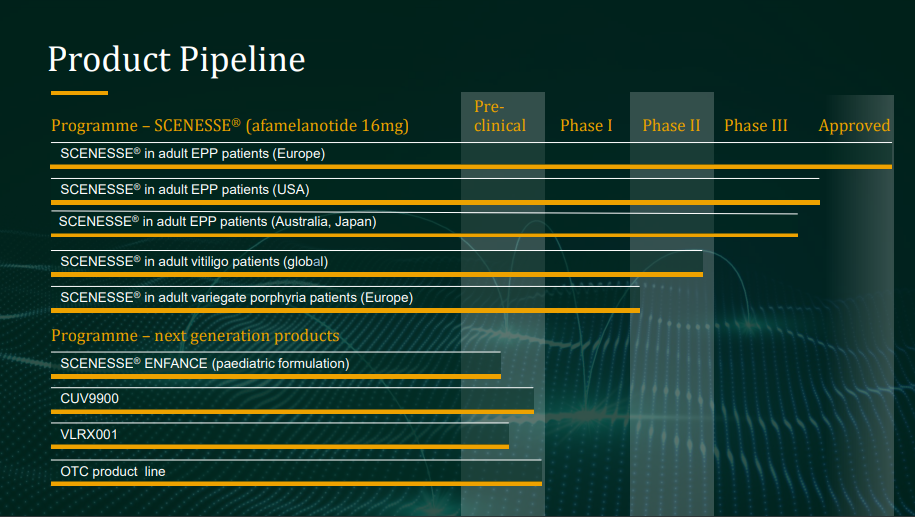
Product Pipeline (Source: CUVâs Presentation Jefferies Healthcare Conference, June 2019)
Conclusion
It is worth noting that the company is recording resilient cash flows except seasonal downturn. More importantly, the cash flows are being sourced from the European jurisdictions, and the company is yet to realise the global potential of the drug.
In its latest newsletter, it has been acknowledged that the US FDA outcome is expected on 6 October 2019, which provides significant growth opportunities, and ultimately more diversified cash flows. Besides, the US FDA has not communicated adverse developments related to the new drug application (NDA) for the company flagship drug.
On 16 August 2019, CUVâs stock last traded at A$25.03, down by 2.607% from the previous close. The stock has provided the return of 42.78% over the year-to-date period. The market capitalisation of the company stands at ~A$1.26 billion, with ~48.96 million shares outstanding.
Disclaimer
This website is a service of Kalkine Media Pty. Ltd. A.C.N. 629 651 672. The website has been prepared for informational purposes only and is not intended to be used as a complete source of information on any particular company. Kalkine Media does not in any way endorse or recommend individuals, products or services that may be discussed on this site. Our publications are NOT a solicitation or recommendation to buy, sell or hold. We are neither licensed nor qualified to provide investment advice.
