
 AUS
AUS
 NZ
NZ
 UK
UK
 CA
CA
 USA
USA
 IND
IND







Summary
- Gold prices have been stable with the gold spot consolidating in the range of $2,610 to $2,698 per ounce.
- The major resistance for the gold spot is now at $2,743.
- The immediate support for the gold spot is at $2,695, a break and price action below which could once again seed short-term bearish sentiments, pushing gold to the lower line of the consolidation range.
- On the flip side, if the current break above the upper line of the consolidation sustains and is followed by a volatility breakout, it could prompt gold to test its next resistance level, i.e., $2,743.
Gold prices are taking a breather after an impeccable rally with the Australian gold spot entering a consolidation between $2,610 to $2,698 per ounce. However, in the recent few trading sessions, gold prices have shown some interesting developments on the daily timeframe, which might point towards resurfacing interest in the yellow shine.
Gold On Charts
Gold On a Daily Chart
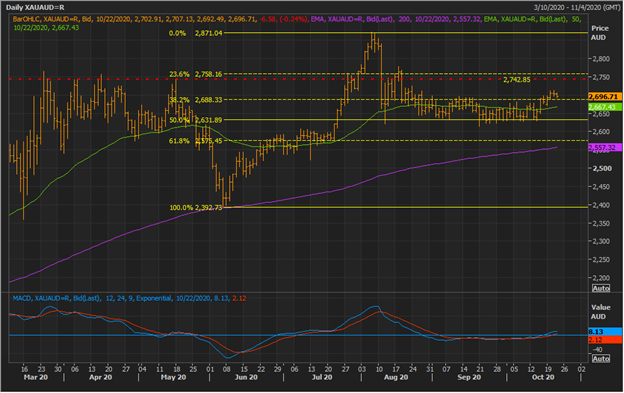
XAUAUD Daily Chart (Source: EODHD/Others Eikon Thomson Reuters)
On the daily chart, it could be seen that gold prices are trading on an upward spiral with prices trending over the 200-day exponential and 50-day exponential moving average (EMAs). Recently (around May 2020 end), gold rebounded from the 200-day EMA and rallied to the recent top of ~ $2,874.00.
However, selling pressure followed, inferred from a large bar stick to the downside, took the price down, and post correcting ~ 50 per cent from the recent rebound point to the top, gold is once again showing some bullish signals.
- The major resistance for the gold spot is now at $2,743.
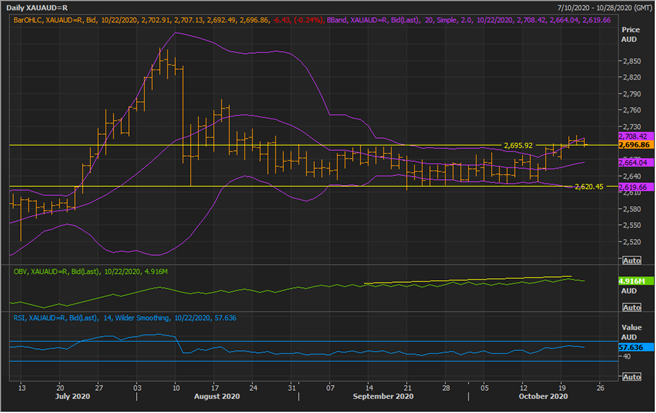
XAUAUD Daily Chart (Source: EODHD/Others Eikon Thomson Reuters)
On closely following the recent price behaviour, near-term consolidation could be seen with the gold spot oscillating between the two horizontal lines placed at $2,695 (upper) and $2,620 (lower), respectively.
However, as mentioned above, the gold spot is now showing some bullish developments on the daily chart.
- In the past few trading sessions, the gold spot attempted a volatility breakout with prices crossing the +2 Standard Deviation of the 20-day simple Bollinger Band®. However, the gold spot failed to sustain the volatility break and is currently testing the upper range of the consolidation.
- The upper range, which previously acted as a resistance for the gold spot, should now reverse the role and act as immediate support for the gold spot across the exchange.
- Thus, immediate support for the gold spot is at $2,695, a break and price action below which could once again seed short-term bearish sentiments, pushing gold to the lower line of the consolidation range.
- Another support for the gold spot is at the lower line of the consolidation range, i.e., at $2,620.
Apart from the above points, another interesting observation supporting the bullish argument is a slight divergence in the On Balance Volume. The upward-sloping OBV against the downside sloping price move reflects accumulation.
On the flip side, if the current break above the upper line of the consolidation sustains and is followed by a volatility breakout, it could prompt gold to test its next resistance level, i.e., $2,743.