
 AUS
AUS
 NZ
NZ
 UK
UK
 CA
CA
 USA
USA
 IND
IND







Highlights
- Ryman Healthcare’s FY2025 total revenue increased to NZD 760.7 million, up 10.26% year-on-year.
- Net operating cash flows decreased to NZD 410.3 million, with free cash flow at -NZD 94.2 million.
- FY2026 ORA sales volumes are tracking above the previous guidance range of 1,100–1,300 units.
Ryman Healthcare Limited (NZX:RYM) is New Zealand based company that provides a range of retirement living options across the nation. For the financial year 2025 (FY25), the company recorded total revenue of NZD 760.7 million, marking a 10.26% increase from NZD 689.9 million in FY24. The company completed 1,523 ORA sales in FY25, consistent with its February guidance. Furthermore, adjustments to the pricing model resulted in an increase in deferred management fees (DMF), raising the value of the future contract book. Net operating cash flows for the year amounted to NZD 410.3 million in FY25, a decrease of 31.08% compared to NZD 595.3 million in FY24. Free cash flow stood at -NZD 94.2 million, in line with February projections, and improved from -NZD 186.9 million in the previous year.
Key positives and Negatives
In FY25, the company cash cycle decreased to 70.9 days from 231.8 days in FY24, while the debt-to-equity ratio fell to 0.40x from 0.69x in the previous year. The company reported a net margin of -57.4% and an operating margin of -29.8% in FY25.
Business Outlook
The company stated that sales volumes for FY2026 have been performing above its earlier guidance range of 1,100–1,300 ORA units.
Share Performance of RYM
RYM’s shares were trading at NZD 2.81 per share on 19 November 2025 with an intraday gain of 1.81%. RYM’s stock has increased by 15.70% in the last three months, 12.00% over the six months but decreased by 38.41% over the past year. RYM’s 52-week high is NZD 4.75, recorded on 25 November 2024, and 52-week low is NZD 2.04, recorded on 04 June 2025.
Support and Resistance Summary
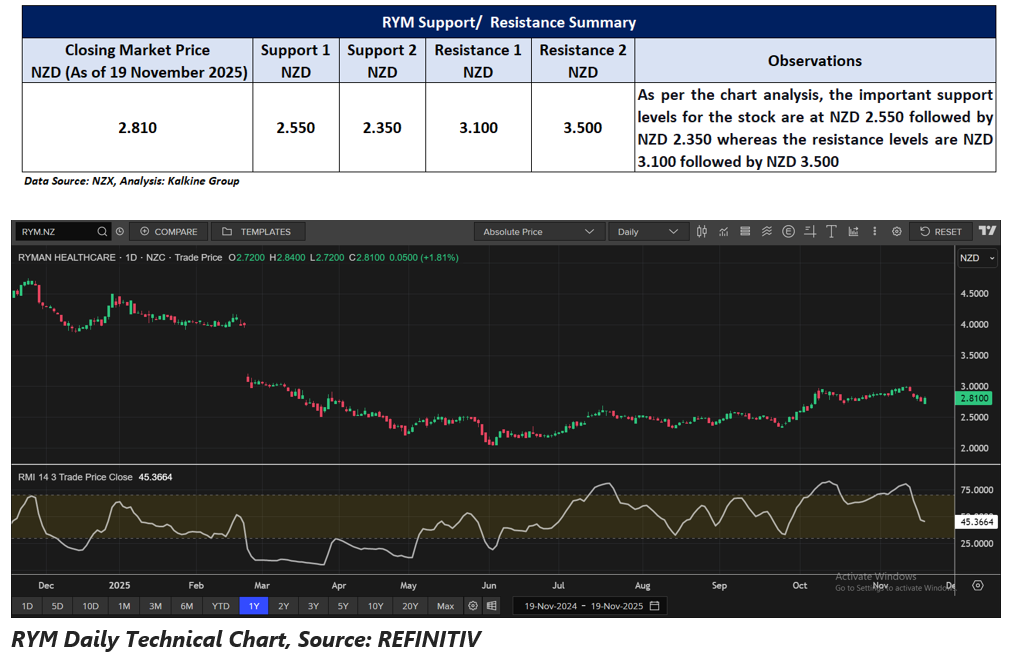
Note 1: Past performance is neither an Indicator nor a guarantee of future performance.
Note 2: The reference date for all price data, and currency, is 19 November 2025. The reference data in this report has been partly sourced from EODHD/Others.
Technical Indicators Defined:
Support: A level at which the stock prices tend to find support if they are falling, and a downtrend may take a pause backed by demand or buying interest. Support 1 refers to the nearby support level for the stock and if the price breaches the level, then Support 2 may act as the crucial support level for the stock.
Resistance: A level at which the stock prices tend to find resistance when they are rising, and an uptrend may take a pause due to profit booking or selling interest. Resistance 1 refers to the nearby resistance level for the stock and if the price surpasses the level, then Resistance 2 may act as the crucial resistance level for the stock.