


_06_18_2026_01_16_25_577485.jpg)

Gold prices are sailing high in the international market and prices of Gold Spot finally managed to cross the US$1,500 mark. The global worries, coupled with demand push from the central banks and global gold-backed ETFs are propelling the precious metal prices. Gold prices denoted in various currencies such as GBP, JPY, and AUD reached a new multi-year record high.
While gold managed to cross the US$1,500 per ounce mark, silver outperformed gold and rose to breach the psychological resistance of US$17 per ounce.
However, now the question which arises is that, would gold be able to sustain these upper levels?
A high demand push from central banks and global gold-backed ETFs is supportive for gold prices and in the recent survey, the World Gold Council had found out that global central banks are now adopting a neutral stance and only a few banks are looking to increase their gold reserves further.
The higher gold prices have hurt the sentiments of gold jewellery makers, as the sudden spike in prices amid global cues have reduced the gold demand in the jewellery form.
On the other counter, the global stock markets are witnessing a bloodbath over the long-term impact of escalated U.S-China trade spat, which in turn, is extending its support to the gold prices.
The bond yields in the global markets are in a freefall mode, which in turn, are taking the bond prices higher and higher along with gold as the global investing community fish for safety.
The bond yields on 30-year U.S. bonds fell from the level of 3.467 per cent in November 2018 to the present month low of 2.133 per cent (Dayâs low on 7 August 2019). Likewise, the bond yields or the market discount rate is declining in the U.S. 10 years treasury bonds.
Gold on Charts:
Gold on a Monthly Chart:
 XAU Monthly Chart (Source: Thomson Reuters)
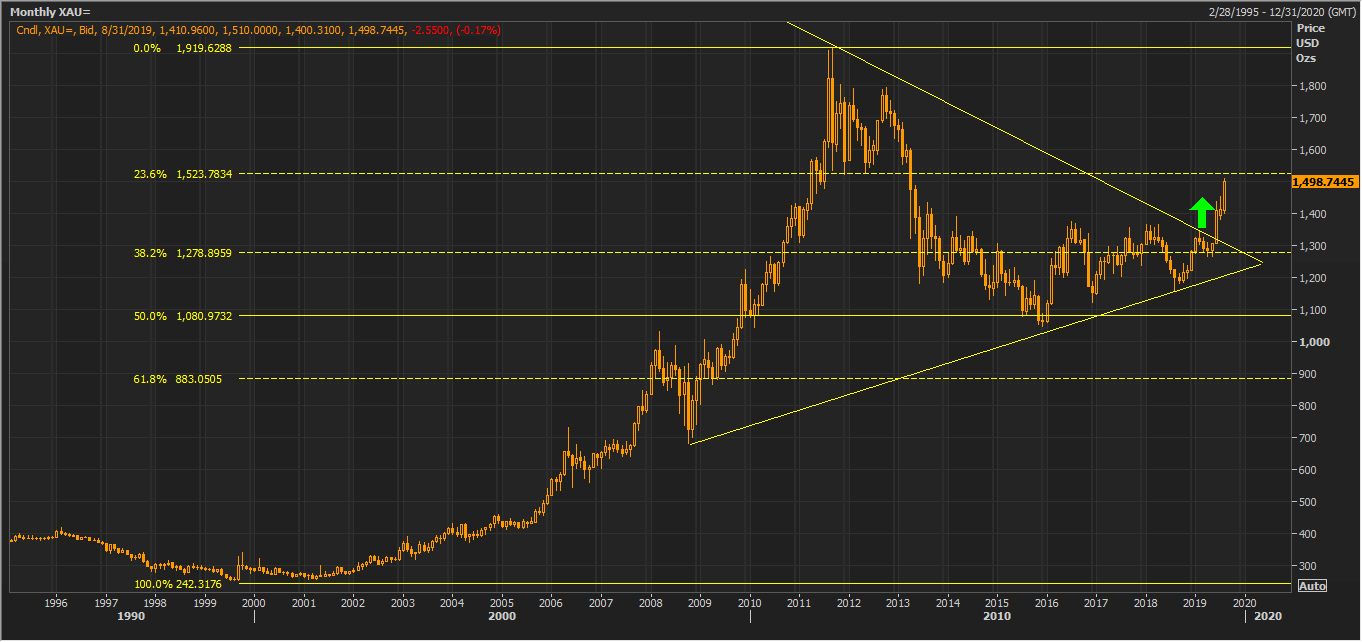
On the monthly chart, the gold prices formed a symmetrical triangle, and recently gold had broken out of the symmetrical triangle. The prices had corrected over 50 per cent of the primary bull rally, which initiated in gold from the level of approx. US$242.3176 in (late 1999) and halted at the level of approx. US$1,919.6288. Post correcting by over 50 per cent of the original rally the prices managed to breach the symmetrical triangle.
Now, if the prices manage to hold the breakout, gold is likely to resume its original uptrend. However, if prices again move inside the triangle, it would be regarded as a false breakout, and long-term investors should closely monitor if the pattern breakout would hold or not.
Gold on the Weekly Chart:
 XAU Weekly Chart (Source: Thomson Reuters)
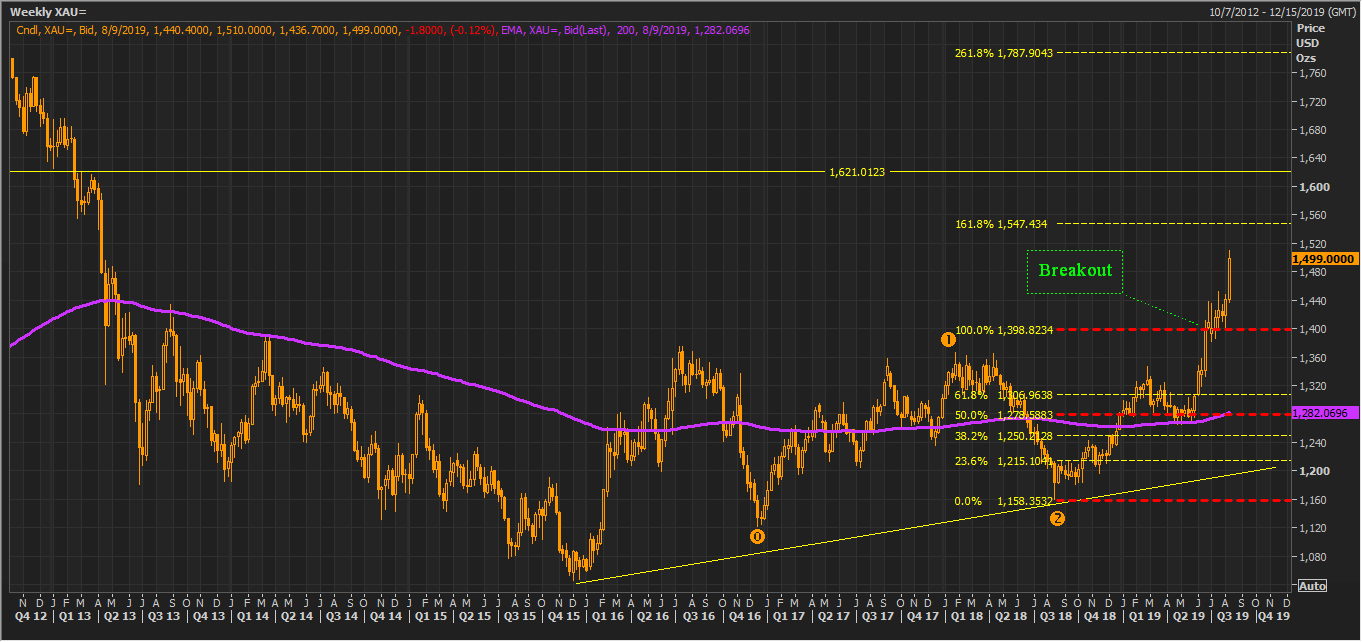
On the weekly chart, the gold prices have taken the support the 200-weeks exponential moving average and rose. The upside wave followed by a correction present points (marked as 0,1,2) to connect the Fibonacci Projections. On following the Fibonacci, the gold prices have comfortably breached the level of 100.0 per cent projected level and are currently taking the support of the same level, which is at US$1,398.8234.
The 161.8 per cent level of the Fibonacci series, which is at US$1547.434 represents the primary hurdle for the gold prices. The secondary hurdle on a weekly start is intact at US$1621.0123, and market participants should keep a track on both the levels as a break above or failure to do so would decide future price actions.
Gold on the Daily Chart:
 XAU Daily Chart (Source: Thomson Reuters)
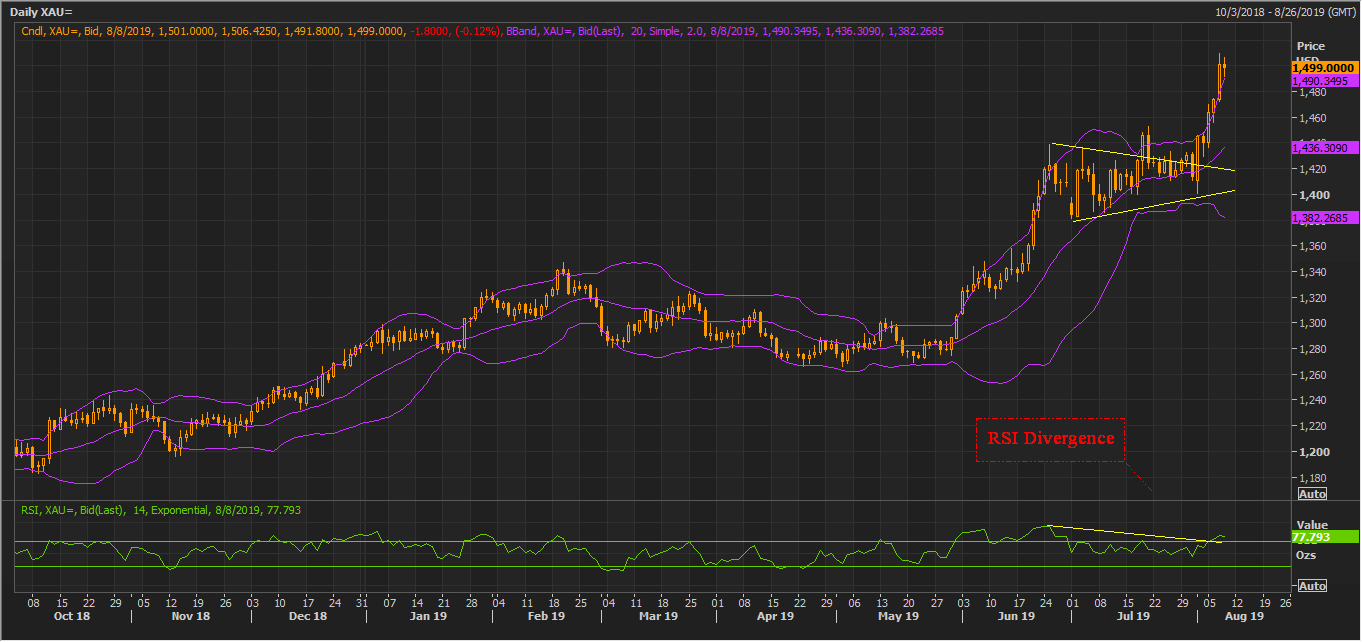
On the daily chart, the gold prices managed to breach the bullish-pennant pattern formed on the daily chart and rose above US$1,500. The gold prices breached the upper band of 20-days exponentially smoothened Bollinger band, which in turn, suggested high volatility in the prices.
The academics suggest that post reaching the upper band, the prices generally retrace to the median of the bands. On the technical front, the 14-days smoothened Relative Strength Index is showing negative divergence with the prices (as seen on the charts above).
Recently, gold prices have made a new high; however, RSI did not follow the price actions, which in turn, suggests that further investigation is required to confirm the goldâs potential of taking a short-term correction.
Silver on Charts:
Silver on the Monthly Chart:
 XAG Monthly Chart (Source: Thomson Reuters)
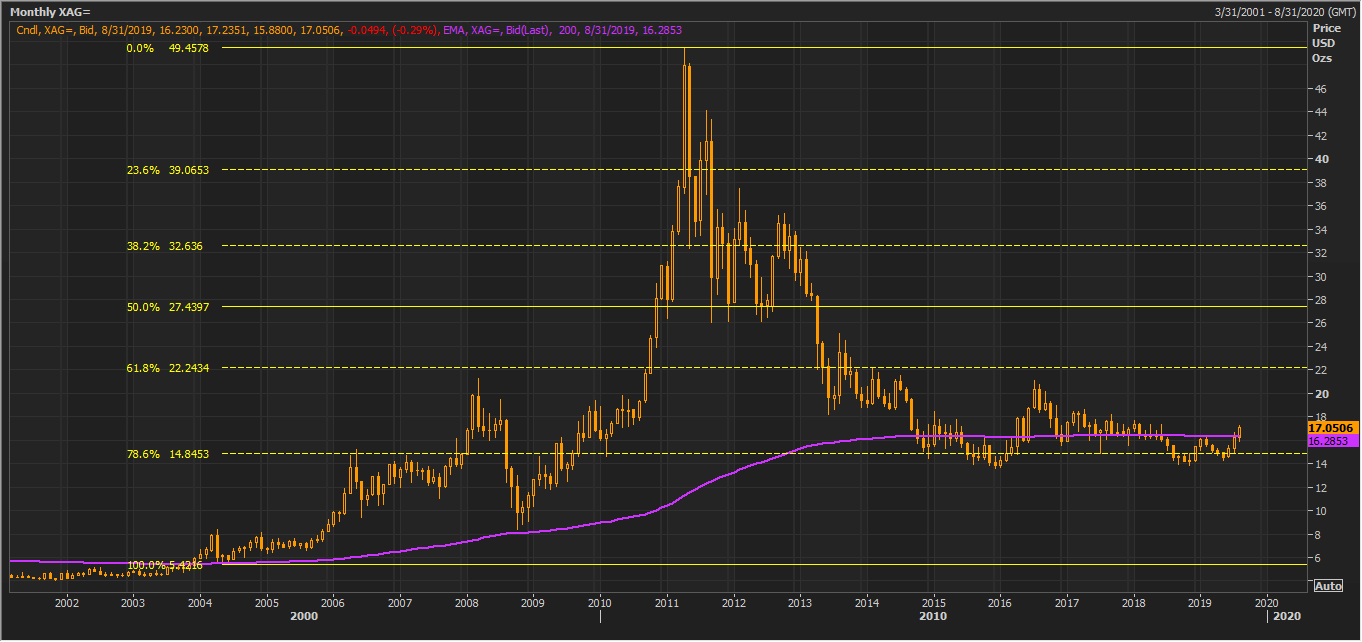
On a monthly chart, the silver prices have corrected over 78.6 per cent of the original upside rally, which started from the level of approx. US$5.4216 in early 2004 and reached the level of US$49.4578 in mid-2007.
On the recent development, the silver prices have corrected over 78.6 per cent of the initial upside rally, and the prices have recently crossed the 200-months exponential moving average, which is at US$16.2853. Investors should monitor the level closely, and few consecutive closes and a weekly close above the same level could provide support to the silver prices.
However, failure to do so would again drag silver in the near-term on a monthly basis.
Silver on the Weekly Chart:
 XAG Weekly Chart (Source: Thomson Reuters)
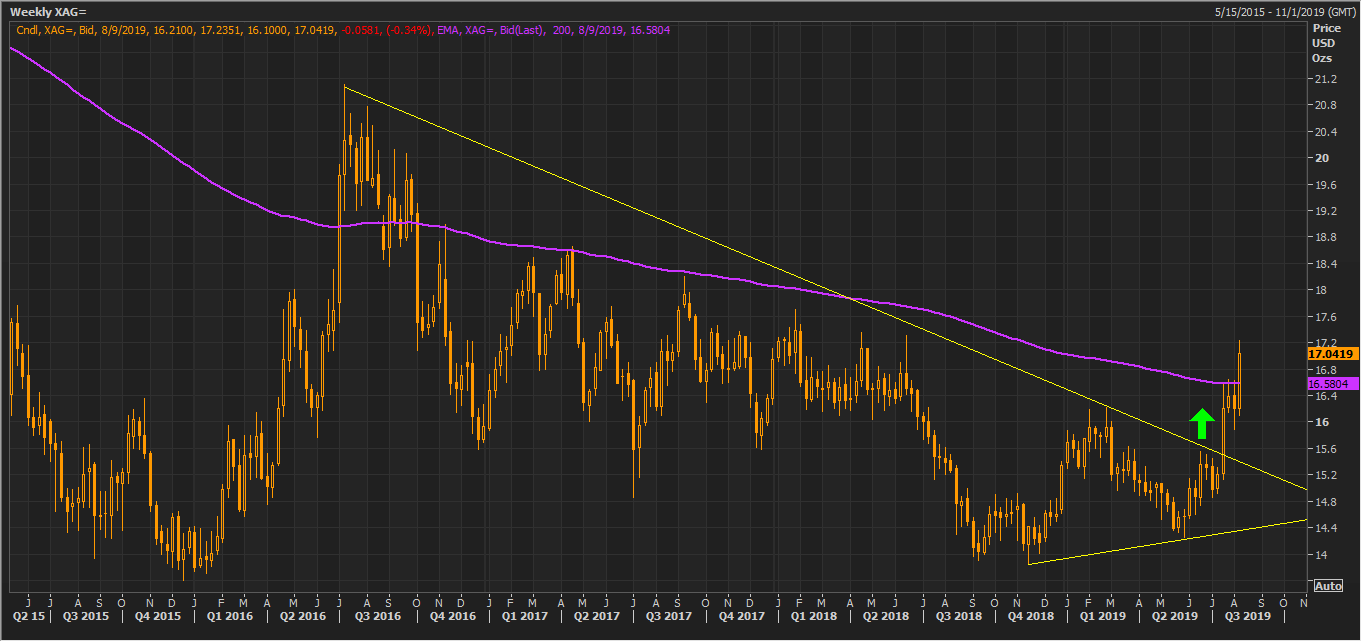
On the weekly chart, the silver prices have given a breakout of the downward sloping trendline, and the prices have crossed the 200-weeks EMA, which is at US$16.5804. Investors should monitor if the breakout holds as sustenance above the breakout level and failure to do so would decide further price actions in silver.
Silver on the Daily Chart:
 XAG Daily Chart (Source: Thomson Reuters)
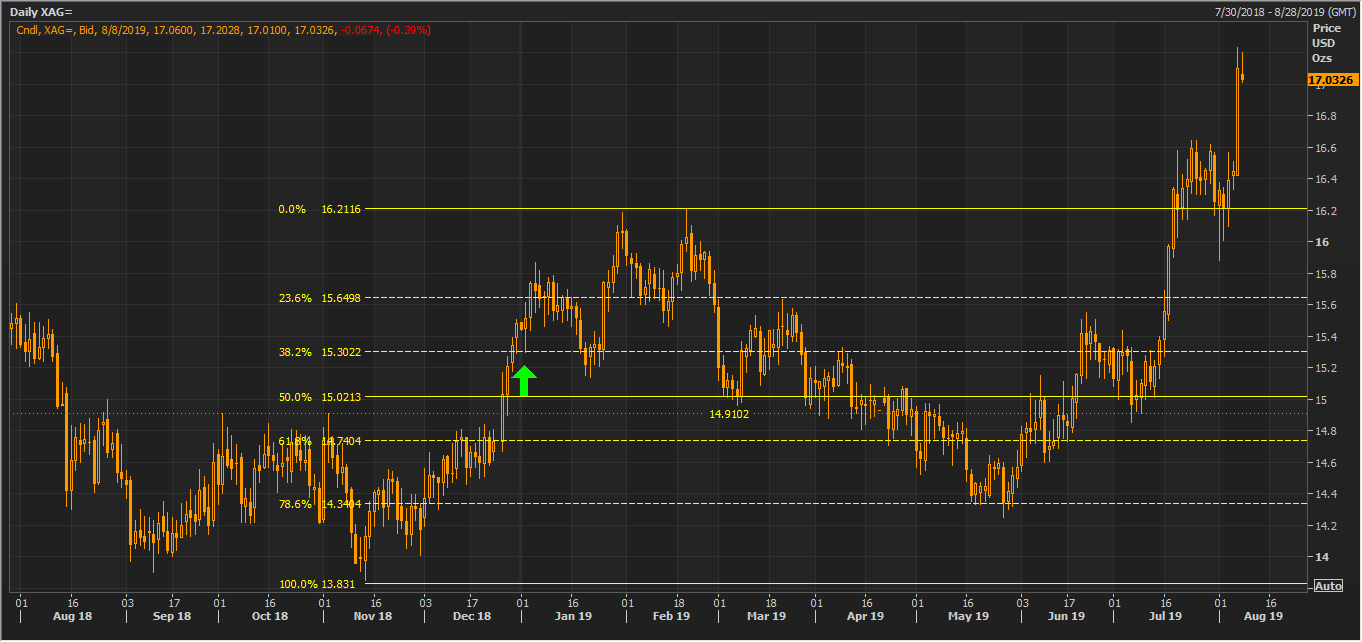
On further zooming the silver price action from the fourth quarter of the year 2018, the silver prices managed to extend rally from the low of US$13.831 marked in the fourth quarter (2018) and halted at the level of US$16.2116 in the first quarter of the year 2019.
Post hitting the level of US$16.2116, the prices again descended on the daily chart and corrected 78.6 per cent of the rally which started from the level of approx. US$13.831 to the level of approx. US$16.2116.
After correcting 78.6 per cent of the rally, the prices witnessed a buying interest and managed to cross the initial hurdle of US$14.9102 to reach the current levels of over US$17.0.
 XAG Daily Chart (Source: Thomson Reuters)
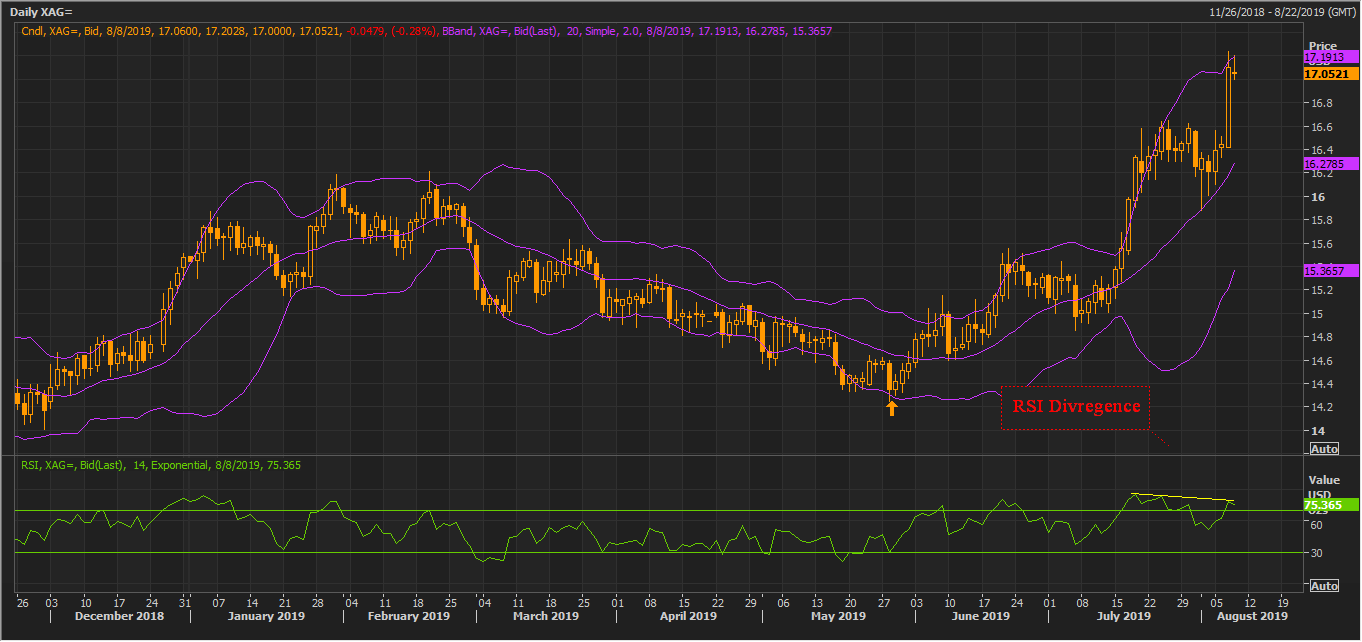
On further following the daily chart, we can observe that the prices have crossed the upper band of the 20 days smoothened Bollinger band and is currently taking the hurdle of the upper band. Investors should monitor the movement of silver prices around the upper band as a break above and failure to do so would decide further price actions in silver.
Recently, silver prices have made a new high; however, RSI did not follow the price actions, which in turn, suggests that further investigation is required to confirm the silverâs potential of taking a short-term correction.
Also Read: Silver to Outperform Gold Ahead?
Did Silver Outperform Gold?
 Silver vs Gold One Month Total Returns (Source: Thomson Reuters)
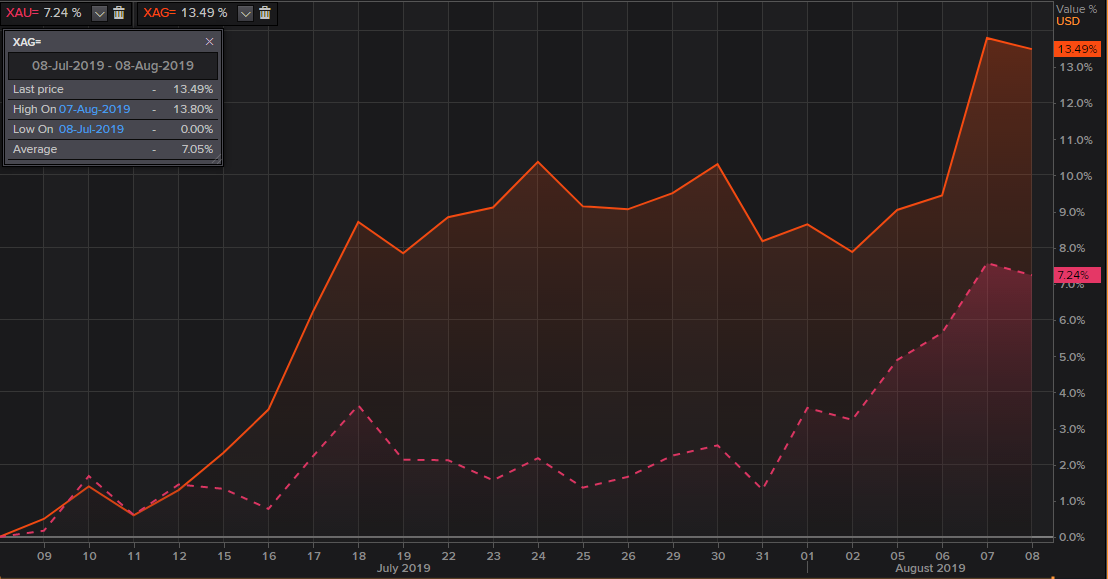
While Gold Spot delivered the total return of 7.24 per cent in the past one month, Silver Spot has clearly outperformed gold in terms of total returns. Silver Spot delivered a total return of 13.49 per cent, which is 6.25 per cent higher, i.e., silver alpha remained 6.25 as compared to gold, while both the assets carry the same beta.
Thus, post considering the risk-adjusted return, silver has outperformed gold over the one-month time frame.
Disclaimer
This website is a service of Kalkine Media Pty. Ltd. A.C.N. 629 651 672. The website has been prepared for informational purposes only and is not intended to be used as a complete source of information on any particular company. Kalkine Media does not in any way endorse or recommend individuals, products or services that may be discussed on this site. Our publications are NOT a solicitation or recommendation to buy, sell or hold. We are neither licensed nor qualified to provide investment advice.
