


Highlights
- ZIP shares are down nearly 38% in the last nine months and are hovering near their 52-week low
- ZIP share is currently trading near a significant support level established by its all-time low in June 2022
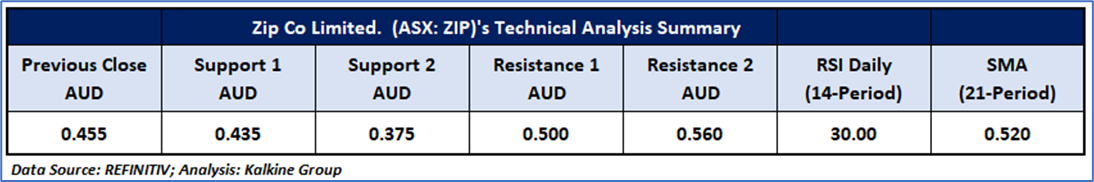
- Important support for the stock is positioned at AUD 0.375, while key resistance is placed at AUD 0.500
Zip Co Limited (ASX:ZIP) shares ended 2.150% lower at AUD 0.455 per share on Wednesday (21 June 2023), near their 52-week low of AUD 0.435 clocked on 29 June 2022.
With today's decline, the stock is now nearly 38% down in the last nine months. Although the stock attempted a rebound earlier this year, the rebound did not last, and the stock again continued its downward trend.
On Tuesday (20 June 2023), the company announced that existing holders of its outstanding zero coupon senior convertible notes due 2028 had approved certain amendments to the terms and conditions of the convertible notes. The company said, along with the concurrent incentivised conversion invitation, this exercise will reduce the company's corporate debt by AUD 192.2 million and strengthen its balance sheet and help it in its next phase of growth.
Let’s study the technical chart of ZIP to get an idea about its near-term movement.
ZIP’s Technical Analysis:
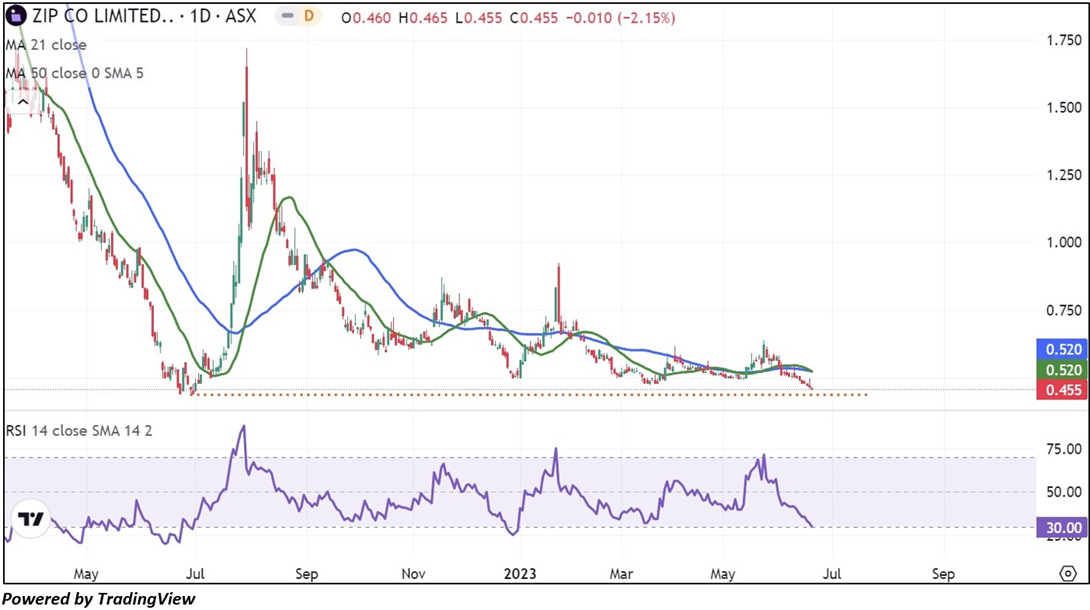
Despite experiencing a downward trend characterised by declining lows and highs, ZIP's stock price is currently trading at a significant support level established by its all-time low in June 2022, which suggests the possibility of a rebound from this level. In addition, the RSI (14- period) is trading near the oversold region and could provide further support for an upside reversal. Prices are trading below the 21-period SMA, which may act as a resistance level for the stock; in contrast, the stock's historical low might act as a resistance level. Important support for the stock is positioned at AUD 0.375, while key resistance is placed at AUD 0.500.
Daily Technical Chart – ZIP
The technical levels for the stock were evaluated as per the closing price of AUD 0.455 per share, down 2.150%, as on 21 June 2023.
Note 1: Past performance is neither an Indicator nor a guarantee of future performance.
Technical Indicators Defined:
Support: A level at which the stock prices tend to find support if they are falling, and a downtrend may take a pause backed by demand or buying interest. Support 1 refers to the nearby support level for the stock, and if the price breaches the level, then Support 2 may act as the crucial support level for the stock.
Resistance: A level at which the stock prices tend to find resistance when they are rising, and an uptrend may take a pause due to profit booking or selling interest. Resistance 1 refers to the nearby resistance level for the stock and if the price surpasses the level, then Resistance 2 may act as the crucial resistance level for the stock.
Stop-loss: It is a level to protect further losses in case of unfavourable movement in the stock prices.
The Green colour line reflects the 21-period moving average. SMA helps to identify existing price trends. If the prices are trading above the 21-period, prices are currently in a bullish trend (Vice – Versa).
The Blue colour line reflects the 50-period moving average. SMA helps to identify existing price trends. If the prices are trading above the 50-period, prices are currently in a bullish trend (Vice – Versa).
The Orange/ Yellow colour line represents the Trendline.
The Purple colour line in the chart’s lower segment reflects the Relative Strength Index (14-Period), which indicates price momentum and signals momentum in trend. A reading of 70 or above suggests overbought status, while a reading of 30 or below suggests an oversold status.
Disclaimer
This article has been prepared by Kalkine Media, echoed on the website kalkinemedia.com/au and associated pages, based on the information obtained and collated from the subscription reports prepared by Kalkine Pty. Ltd. [ABN 34 154 808 312; AFSL no. 425376] on Kalkine.com.au (and associated pages). The principal purpose of the content is to provide factual information only for educational purposes. None of the content in this article, including any news, quotes, information, data, text, reports, ratings, opinions, images, photos, graphics, graphs, charts, animations, and video is or is intended to be, advisory in nature. The content does not contain or imply any recommendation or opinion intended to influence your financial decisions, including but not limited to, in respect of any particular security, transaction, or investment strategy, and must not be relied upon by you as such. The content is provided without any express or implied warranties of any kind. Kalkine Media, and its related bodies corporate, agents, and employees (Kalkine Group) cannot and do not warrant the accuracy, completeness, timeliness, merchantability, or fitness for a particular purpose of the content or the website, and to the extent permitted by law, Kalkine Group hereby disclaims any and all such express or implied warranties. Kalkine Group shall NOT be held liable for any investment or trading losses you may incur by using the information shared on our website.