


_07_03_2026_03_50_21_133108.jpg)

Highlights
- Barrick Gold Corporation's (NYSE:GOLD) annualized dividend is US$0.40, and the dividend yield is 1.56%.
- Franco-Nevada Corporation (NYSE:FNV) has a dividend yield of 0.81%, and its annualized dividend is US$1.28.
- Newmont Corporation (NYSE:NEM) has a dividend yield of 3.25% with an annualized dividend of US$2.20.
Gold prices climbed above the US$1900 mark on Wednesday as Ukraine declared an emergency amid the heightened threat of Russian invasion. Gold stocks are considered a better inflation hedge than any other assets - no wonder why these stocks are rising.
In contrast, stocks are on a downhill slide, with the combined impact of inflation and geopolitical tensions. The benchmark S&P 500 index fell 3.9% in the last six months.
Bitcoin (BTC), the world’s largest cryptocurrency by market share and sways the larger crypto market, fell 43% from its peak in November last year, reflecting the market’s volatile nature.
Against this backdrop, can the yellow metal stocks be a better hedge against volatility?
Here we explore the top five picks:
Also Read: S&P 500’s top oil and gas stocks to watch as prices shoot up
Barrick Gold Corporation (NYSE:GOLD)
Closing price on February 22, 2022: US$22.76
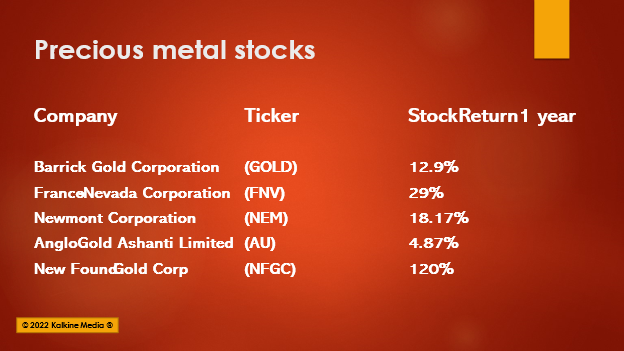
One year return: 12.9%
The company has a market capitalization of US$41.12 billion. Toronto-based Barrick Gold is one of the largest gold producers in the world. Its mines are in the Americas, Africa, and Australia.
The GOLD stock traded in the range of US$25.37 to US$17.27 in one year. The company’s annualized dividend is US$0.40, and its dividend yield is 1.56%.
In the fourth quarter and fiscal 2021, its output was in line with its guidance. It saw strong free cash flow from operations. The net cash was US$130 million at the end of the year.
The revenue was US$11.99 billion in FY2021 compared to US$12.6 billion in the previous year. The net income came in at US$3.29 billion or US$1.14 EPS diluted versus US$3.61 billion or US$1.31 EPS diluted in FY2020.
Also Read: From RIVN to TSLA: top 7 to watch as EV stocks brave global selloff
Also Read: High-potential metaverse stocks to watch now – MSFT, NVDA to FB
Franco-Nevada Corporation (NYSE:FNV)
Closing price on February 22, 2022: US$144.74
One year return: 29%
Franco-Nevada Corp is a royalty and investment company based in Ontario, Canada. It does not operate mines but earns revenue from the royalty streams.
The company has a market capitalization of US$28.07 billion, with a dividend yield of 0.81% and an annualized dividend of US$1.28. The P/E ratio is 40.66.
The FNV stock price range has been between US$163.79 and US$105.62 in the last 52 weeks.
The company will release its fourth quarter and full-year 2021 results on March 9, 2022. For the third quarter, its revenue grew 13% YoY to US$316.3 million, and the net income rose 8% YoY to US$166 million or US$0.87 per share diluted. Its operating cash flow for the September quarter was US$206.9 million, and its quarterly dividend was US$0.30 per share.
Also Read: Explore these top gaming stocks – from RBLX to AMC
Newmont Corporation (NYSE:NEM)
Closing price on February 22, 2022: US$67.17
One year return: 18.17%
Denver, Colorado-based Newmont is one of the largest gold producers globally. It was named in the Fortune 2022 list of the world’s most admired companies.
Its current market capitalization is US$54.58 billion. The NEM stock traded in the range of US$75.31 to US$52.60 in the last 52 weeks. It has a P/E ratio of 27.05 and a dividend yield of 3.25%, with an annualized dividend of US$2.20.
For the September quarter of 2021, its revenue was US$2.9 billion, and the net loss was US$243 million or US$0.60 per share diluted. For the same period in the previous year, the revenue was US$3.17 billion, and the net income was US$856 million or US$0.86 per share diluted.
Also Read: Hot penny stocks ACY, NANX, UONEK, & 4 more that gave over 70% return
AngloGold Ashanti Limited (NYSE:AU)
Closing price on February 22, 2022: US$21.98
One year return: 4.87%
Its current market capitalization is US$9.53 billion. The dividend yield is 0.55%, and the annualized dividend is US$0.122. The stock traded in the range of US$26.77 to US$14.57 in one year.
The Johannesburg-based company explores gold. It also produces silver and sulphuric acid. It generates most of its revenue from Africa.
For FY2021, its revenue was US$2.06 billion, and the net income was US$260 million. The revenue and net income were US$2.46 billion and US$532 million, respectively, in fiscal 2020.
Also Read: Top 5 defense stocks: LMT, BA NOC rise amid geopolitical tension
Source: Pixabay
Also Read: S&P 500’s KMI, VNO among top 7 dividend stocks to watch now
New Found Gold Corp (AMEX: NFGC)
Closing price on February 22, 2022: US$6.06
One year return: 120%
New Found Gold Corp is a mineral exploration company based in British Columbia, Canada. It is engaged in acquiring, exploring, and evaluating resource properties in Canada.
For the September quarter of 2021, its operating loss was US$12.27 million compared to an operating loss of US$8.57 million in the same period in 2020. The net loss was US$35.29 million versus a net loss of US$11.11 million in the September quarter of the previous year.
The company launched its IPO in 2020 and has a current market capitalization of US$998.19 million.
Also Read: Top 9 energy ETFs: Can XLE, FENY protect against market volatility?
Bottomline
Gold stocks are considered safe havens in a volatile market scenario. However, investors should carefully evaluate the companies and the broader market before investing in stocks.
