


_10_04_2024_16_38_50_427275.jpg)

Hochschild Mining PLC
Peru headquartered, Hochschild Mining Plc (HOC) is a precious metal maker company. The company is mainly focusing on the good quality gold and silver deposits. The company has been around for more than fifty years with presence in the American region. The company has mine operations in Peru (southern region) and Argentina. The company prefers cut and fill mining method and operates in epithermal vein mines. The ore obtained from mining operations is converted into gold-silver concentrate. The company has regional offices in London and Argentina.
HOC-Recent developments
On 23rd October 2019, the company has announced the Q3 2019 production report. The group reported another robust quarter with production of 4.3 million ounces of silver, 67,797 ounces of gold, 9.8 million silver equivalent ounces, and 121,395 gold equivalent ounces. The groupâs net debt stood at approximately $30 million as at 30th September 2019 against the $61 million as at 30 June 2019. On 15th January 2020, the company will announce the Q4 2019 Hochschild Mining Production Results. HOC-Financial Highlights for H1 FY19 period ended 30th June 2019
(Source: LSE)
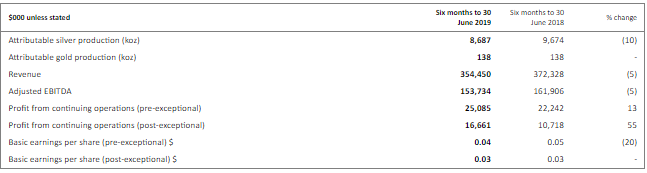
In the first half of the financial year 2019, the companyâs reported revenue reduced by 5 per cent to $354,450 thousand against the $372,328 thousand in H1 FY2018, driven by a decrease in the average price of silver. The total net profit of the year 2019 stood at $16,661 thousand in H1 FY2019 against $10,718 thousand in H1 FY2018. The total basic and diluted earnings per share were US$0.03 in H1 FY2019 against the US$0.03 in H1 FY2018. Interim dividend per share was 2 cents, a surge from 1.965 cents in H1 FY18.
In H1 FY19, the companyâs top-line and bottom-line performance decreased. Despite the weak fiscal performance, the group is anticipating a rise in demand for both silver and gold. With the international financial markets started to experience volatility, the growth prospects of precious metals will increase in the year 2019. The groupâs growth strategy revolves around lower costs, optimising projects at earlier stages and strategic partnerships to maximize the shareholdersâ value. The groupâs board declared an interim dividend per share of 2 cents, which reflects the ongoing successful operational and strategic performance.
HOC-Share price performance
(Source: Thomson Reuters)
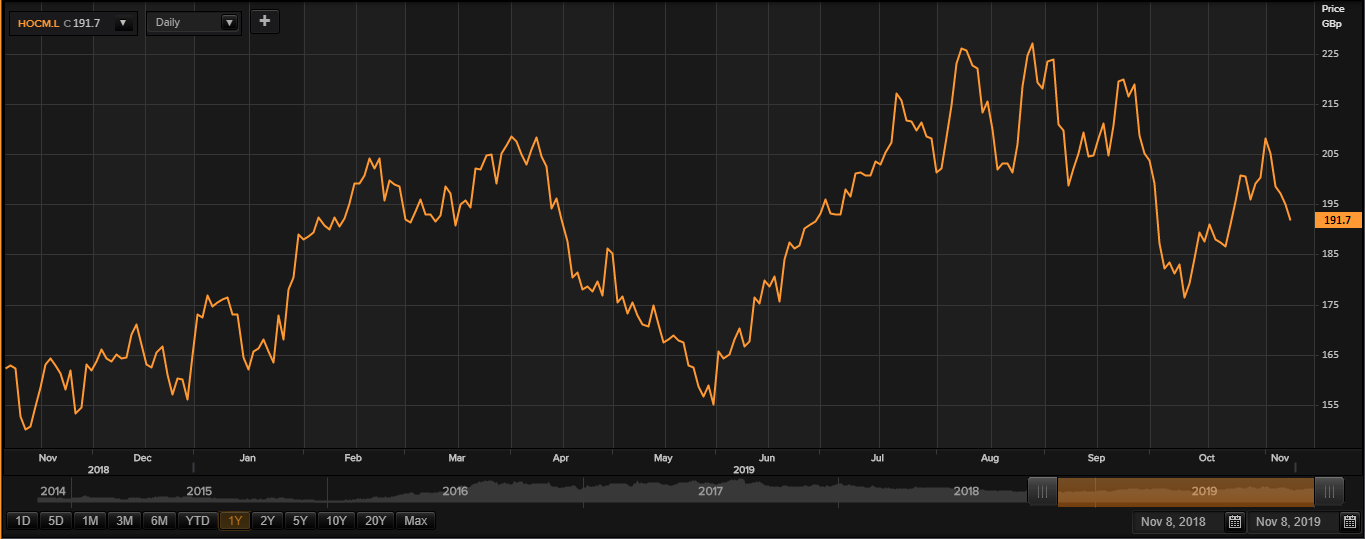
While writing (as on 08th November 2019, at 02:36 PM GMT), Hochschild Mining PLC shares were trading at GBX 191.70 per share. Total market capitalisation of the company was around £997.43 million.
In the past one year, the companyâs shares have touched a high of GBX 232.20 (as on August 13th, 2019) and a low of GBX 146.80 (as on November 14th, 2018).
The stockâs volume before the market close, stood at 244,201 at the time of writing. Stock's average daily traded volume for 5 days was 912,963.40; 30 days- 1,102,663.87 and 90 days â 1,189,307.59. The companyâs stock beta (5Y monthly) was 2.14, which makes it more volatile as against the benchmark index. The shares of the company were trading above the 30-days and 200-days SMA, at the time of writing.
HOC shares have delivered positive return of 6.27 per cent in the past one month. The stock surged by approximately 24.83 per cent on a YTD (Year-to-Date) time interval and was down by 12.65 per cent in the last three months.
BT Group
London, the United Kingdom-based BT Group (BT.A) is a provider of Fixed-line telecommunication service. It offers copper and fibre connections between exchanges, homes and businesses.
BT Group-Recent News
On 9th October 2019, the company introduced a set of products, skilled programmes, and new services to help make a well-connected and more competitive UK. Bringing the company brand back to the United Kingdom high streets in more than six hundred stores, the group will be launching a new team of nine hundred Home Tech Experts to support people with digital tech in their homes, and to assist in the workplace too.
BT Group-Financial Highlights for H1 FY20 (£, million)
(Source: LSE)
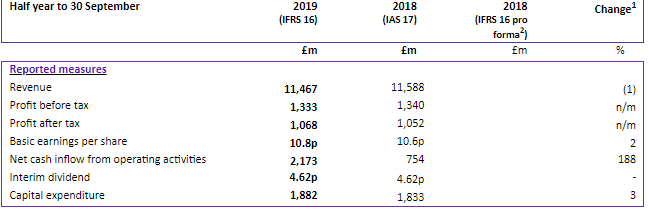
In the first half of the year 2020, the companyâs reported revenue decreased by 1% to £11,467 million as compared with the corresponding period of the last year, because of regulation, strategically reducing low margin business, and decline in the legacy products. Adjusted revenue was down by 2% to £11,413 million in H1 FY19. In H1 FY19, the profit before tax was almost the same from the corresponding period of the previous year, while adjusted EBITDA reduced by 3% to £3,923 million, driven by an increase in the content costs, spectrum fees, and investment to enhance competitive positioning. Basic earnings per share surged by 2% to 10.8 pence against the same period in 2018. Net cash inflow from operating activities stood at £2,173 million in H1 FY19; normalised free cash flow was down by 38% to £604 million, driven by the increased capital expenditure, higher interest and tax payments, partly offset by one-off cash flows. Capital expenditure was up by 3% to £1,882 million, due to increased network investment. The interim dividend per share was 4.62 pence and remained the same from the previous year same period data.
The company declared results in line with the anticipations for the first half of the financial year 2020.The company stay on track to meet the outlook for the financial year 2020. The groupâs board is confident that the company will create value from further investment in the near term with fair, predictable and competitive pricing.
BT Group-Share price performance
(Source: Thomson Reuters)
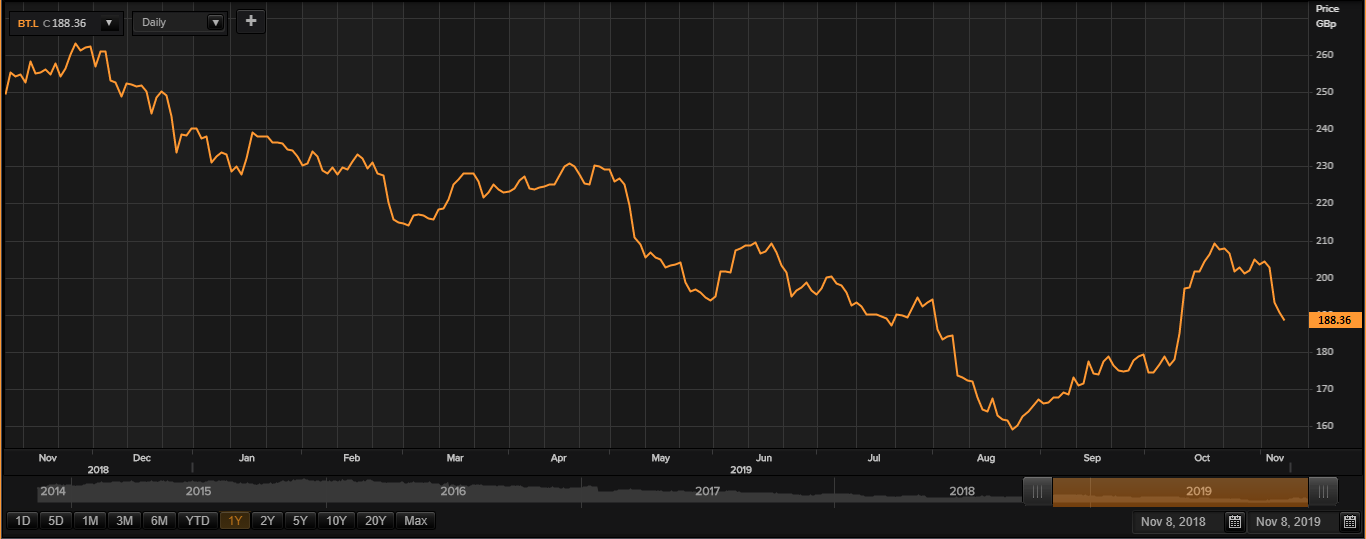
While writing (as on 08th November 2019, at 02:40 PM GMT), BT Group shares were trading at GBX 188.36 per share. Total market capitalisation of the company was around £18.87 billion.
In the past one year, the companyâs shares have touched a high of GBX 268.00 (as on November 28th, 2018) and a low of GBX 157.67 (as on August 27th, 2019).
The stockâs volume before the market close, stood at 8,182,793 at the time of writing. Stock's average daily traded volume for 5 days was 24,465,530.20; 30 days- 22,864,536.87 and 90 days â 23,347,365.78. The companyâs stock beta (5Y monthly) was 0.80, which makes it less volatile as against the benchmark index. The shares of the company were trading below the 30-days and 200-days SMA, at the time of writing.
BT shares have delivered positive return of 6.58 per cent in the past one month. The stock plunged by approximately 20.03 per cent on a YTD (Year-to-Date) time interval and was up by 3.25 per cent in the last three months.
