


Summary
- Fastly (NYSE:FSLY) and Lightspeed (LSPD:TSX) among top trending stocks in Canadian markets this week.
- Lightspeed declared Q1 2021 results that shows revenue of US$36.2 million.
- In Q3 2020, Fastly became available on the Google Cloud Marketplace.
- The S&P/TSX Capped Information Technology Index has advanced by 43.90 per cent year-to-date.
Covid-19 has impacted not just ways of daily life and people movement but also changed how organisations used to work before the pandemic outbreak. Teams now collaborate in a virtual environment using tech tools from the convenience of their homes. Looking beyond the FAANG stocks, the two top trending tech stocks in Canada this week are Fastly Inc (NYSE:FSLY or FSLY:US) and Lightspeed POS Inc (TSX:LSPD).
With the new work-from-home arrangement coming to play and businesses finding new ways to tackle daily-life challenges, the tech sector is at the cusp of change. There has been a sudden surge in demand for networking equipments, mobile and laptops, video-conferencing tools, ecommerce channels for shopping and on-demand video content platforms for entertainment and e-learning. This has helped the technology companies, video content producers and internet service providers clock huge profits during the lockdown.
For investors looking at parking their money in tech stocks, this might probably be the right time to explore, navigate the terrain of booming tech space and invest cautiously.
The S&P/TSX Capped Information Technology Index has advanced by 43.90 per cent year-to-date.
Lightspeed POS Inc. (TSX:LSPD)
Current stock price: C$ 47.27
Lightspeed POS Inc (LSPD:TSX) provides global cloud omni-channel commerce platform to empower small and medium-sized businesses across industries to help them engage with their customers better, accept payments, manage operations and day-to-day workings with agility. LSPD products are sold directly via the company’s sales force in North America, Australia and Europe primarily. The sale of LSPD products to other countries is carried out by indirect sales channels such as resellers and distributors in other regions.
In September 2020, LSPD closed an initial public offering (IPO) in the United States and raised US$ 397.7 million. This fund will be used by the company to strengthen its financial position and fund its strategic growth plans. Lightspeed is also collaborating with Google on many broad-based initiatives such as the Google My Business advanced profile listing solutions. Lightspeed customers will get a professional Google My Business listing setup and can manage their listings directly from the Lightspeed user interface.
LSPD STOCK PERFORMANCE
The company has a current market capitalization of C$ 4.2 billion. The year-to-date performance of the stock has increased by 31 per cent from C$ 36.07 at the beginning of the year to C$ 47.27 as of date. The 10-day average volume of shares trading is 6.35 million with a profit-to-book ratio of 11.07. The TSX data shows negative return on equity and assets for LSPD at -24.57 per cent and -17.83 per cent, respectively. There has been no dividend declared by the company as of date.
LSPD FINANCIAL HIGHLIGHTS
Lightspeed Payments in partnership with Stripe was launched for US retailers in August 2020 to help them access automated reporting, enable tailored and efficient funding source for retailers. It also provides advances up to US$ 50,000 per retail location and allows for flexible repayments from customers by leveraging on Stripe’s capacity for capital-keeping.
There has been a 51 per cent year-on-year increase in customer locations from 51,000 in Q1 2020 to 77,000 in first quarter 2021 financial results (Q1 2021), as per the company report. It also saw 53 per cent year-on-year increase in Gross Transaction Volume (GTV) from US$15.6 million in LTM Q1 2020 to US$ 23.1 million in LTM Q1 2021.
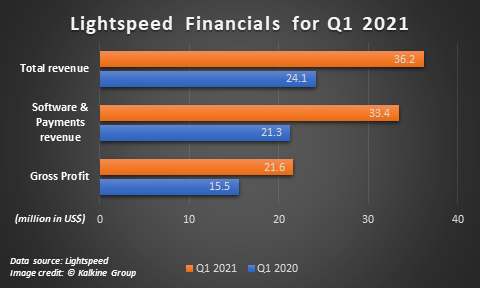
According to unaudited Q1 2020 financial results for the three months ended June 30, 2020, the total revenue is US$ 36.2 million, up 51 per cent from US$ 24.06 million in the same quarter last year. The gross profit is US$ 21.6 million in the latest quarter, as compared to US$ 15.54 million in the same period a year before.
The net loss from cash flows used in operating activities has increased from US$ 9 million Q1 2019 to US$ 20 million in Q1 2020. The net loss per common share basic and diluted stood at minus $(0.22) in June 2020 from US$ negative 0.11 in the same quarter a year ago.
Fastly Inc. (NYSE:FSLY or FSLY:US)
Current stock price: US$ 120.33
Fastly is a power edge cloud platform that empowers developers to secure, run, develop websites and applications to meet customer demands across different industry segments. With the use of technology, the company aims at improving human lives through focus on transparency, integrity and inclusion. The platform helps businesses across industries scale faster and more securely.
In October 2020, Fastly completed acquisition of Signal Sciences to broaden its security portfolio and offer next-generation cybersecurity solution for its developers.
FSLY STOCK PERFORMANCE
Post acquisition of Signal Sciences, Fastly’s stocks shot up by 28 per cent month-to-date. The scrips have advanced by nearly 500 per cent year-to-date. The company has a current market capitalization of US$11.64 billion. The 10-day average volume of shares traded is 6.27 million with a profit-to-book (P/B) ratio of 24.759. The stock shows negative return on equity and assets, as per data on the TSX.
FSLY FINANCIAL HIGHLIGHTS
In the second-quarter ended June 30, 2020, FSLY registered strong top-line of US$75 million, an increase by 62 per cent year-over-year. The dollar-based net expansion rate (DBNER) advanced from 133 percent in Q1 2020 to 137 per cent in Q2 2020. DBNER is a metric used by Software-as-a-Service (SaaS) companies to measure growth rate from existing customers.
The GAAP basic and diluted net loss per share in Q2 2020 is US$ 0.14, up from net loss per share of US$ 0.26 in Q2 2019.
The company’s gross profit grew to US$44.9 million Q2 2020, up from US$25.38 million a year ago.
An increase in headcount and personnel-related investments prompted increase in research and development expenses from US$11 million in Q2 2019 to US$17 million in Q2 2020. Sales and marketing expenses also rose from US$17 million in Q2 2019 to US$25 million in Q2 2020. General and administrative expenses almost doubled during the year from US$9 million in Q2 2019 to US$18million in Q2 2020.
Total operating expenses increased from US$ 37 million in Q2 2019 to US$59million in Q2 2020. The cash used in operations was US$ 9 million and the second quarter of 2020 ended with $454 million in cash and investments in marketable securities.
