


Scapa Group Plc (SCPA) is a supplier of adhesive-based products and bonding solutions to the Industrial and Healthcare markets globally. The company is having a global presence with production facilities in the US, Europe and Asia. The company, with its strong supply chain capabilities and worldwide service, cater to the needs of its customers. The companyâs operations are divided into two business units being Industrial and Healthcare.
Scapa Industrial works on two business models based on Commercial Products and Engineered Products to cover a diverse range of market segments. Scapa Healthcare provides solutions related to Medical Device Fixation, Advanced Wound Care, Drug Delivery markets and Consumer Wellness.
Recently, the ConvaTec Inc terminated the MSA (Master Supply Agreement) with Scapa Tapes North America LLC. The company received a notice for a declaratory judgment filed by ConvaTec New Jerseyâs federal court. The master supply agreement provides for a binding contract with a commitment of US$30m of revenue (approx.) per annum. The company didnât accept the grounds on which the contract was terminated and will contest and defend their rights under the MSA.
Financial Highlights â Financial Year 2019 (£, million)
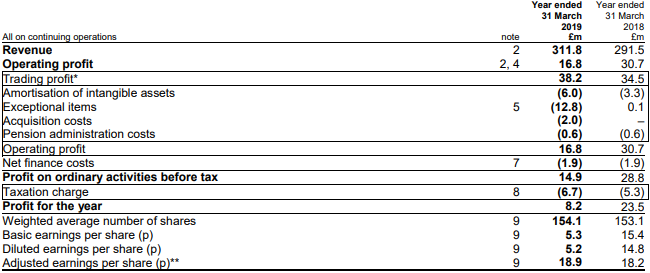
(Source: Annual Report, Company Website)
In the financial year ending 31st March 2019, the companyâs reported revenue was £311.8 million against £291.5 million in FY2018. There was an increase of 7 per cent due to an increase in the revenue from the healthcare division by 25.3 per cent and the company acquired Systagenix and BioMed which further impacted the revenue growth.
The companyâs EBITDA stood at £45.9 million in FY2019 against £40.8 million in FY2018. The companyâs operating profit declined by 45.27 per cent to £16.8 million in FY2019 from £30.7 million in FY2018, due to business reorganisation, site closure and acquisition of Systagenix.
In FY2019, the groupâs trading profit was up by 10.7 per cent to £38.2 million versus £34.5 million in FY2018. On a continuing basis, the trading profit for FY2019 stood at £34.6 million against £34.5 million in FY2018.
The companyâs pre-tax profit for FY2019 was £14.9 million against £28.8 million in FY2018. The adjusted profit before tax stood at £36.8 million in FY2019 against £27.6 million in FY2018. The profit after tax for FY2019 declined by £15.3 million to £8.2 million from £23.5 million in FY2018.
The basic earnings per share stood at 5.3 pence in FY2019 against 15.4 pence in FY2018. The diluted earnings per share stood at 5.2 pence in FY2019 against 14.8 pence in FY2018.
The adjusted earnings per share stood at 18.9 pence in FY2019 versus 18.2 pence in FY2018. The companyâs final dividend surged by 20.8 per cent to 2.9 pence in FY2019 from 2.4 pence in FY2018.
Scapa Group Plc Share Price Performance
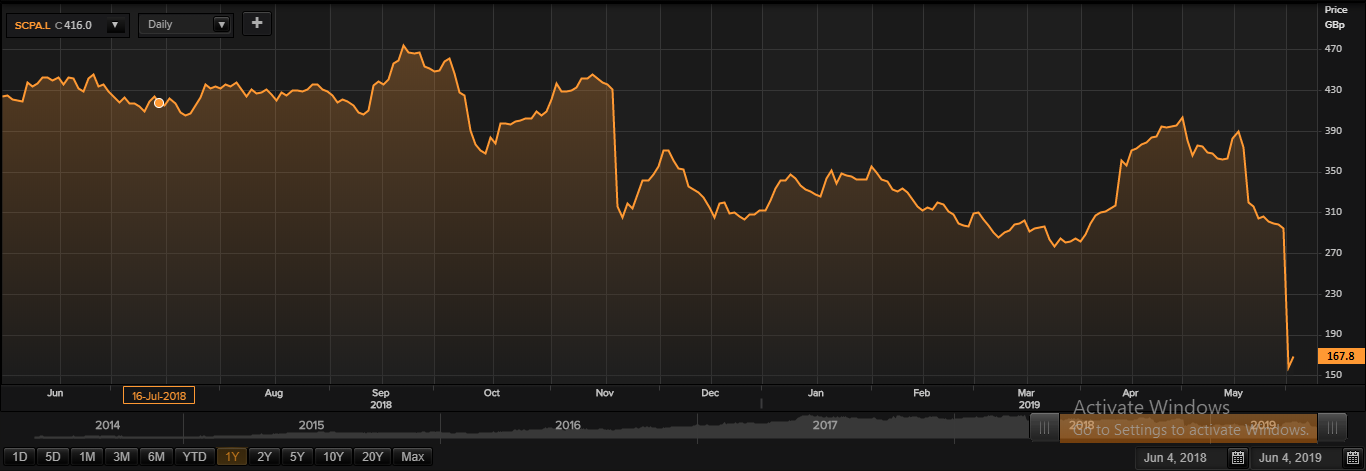
Daily Chart as at June-04-19, before the market close (Source: Thomson Reuters)
On June 4th, 2019, Scapa Group Plc shares were trading at GBX 167.8 (at the time of writing before the market closed, at 02:20 PM GMT), up by 6.88 per cent against the previous day closing price. Stock's 52 weeks High and Low is GBX 473.80/GBX 145.00. At the time of writing, the share was trading 64.58 per cent lower than the 52w High and 15.72 per cent higher than the 52w low.
Stock's average traded volume for 5 days was 3,299,839.40; 30 days - 1,052,179.77 and 90 days -595,153.44. The average traded volume for 5 days was up by 213.62 per cent as compared to 30 days average traded volume.
The companyâs stock beta was 1.16, reflecting higher volatility as compared to the benchmark index. At the time of writing, the outstanding market capitalisation was around £252.19 million, with a dividend yield of 1.75 per cent.
