


.jpg)

AIM-listed Summit Therapeutics Plc is a pharmaceutical and biotechnology company. The group is engaged in the discovery and development of the drug that offers therapies. The company conducts research and development on the treatment of rare diseases and infectious diseases, including duchenne muscular dystrophy and the infectious disease caused by the bacteria C difficile. It develops ridinilazole, an antibiotic that has the potential to treat CDI and reduce disease recurrence. Summit undertakes utrophin modulation program for duchenne muscular dystrophy. The company also develops a novel antibiotic program for the treatment of superbug C. difficile. The group is based out in Oxfordshire, the UK.
Recently (as on June 12), the pharmaceutical company reported its first quarter results for the period ended April 30, 2019. Realised revenue for the first quarter of FY19 stood at £0.2 mn against the revenue of £3.9 mn recorded in the corresponding period of the previous financial year.
The drug developer witnessed a steep plunge in its top-line during the period under review, primarily because of the revenue from Sarepta licence slumped during the period and also on account of companyâs decision to discontinue of ezutromid in June 2018.
During the first quarter of 2019, the group recognised other operating income of £4.9 mn, on account of the groupâs funding contract with BARDA for ridinilazole development.
Research and development overheads of the healthcare group soften to £8.3 mn as compared with the £11.6 mn recorded during the first quarter of the previous financial year. C. difficile infection (CDI) related expenses surged to £5.8 mn and recorded an increase of £0.8 mn during the Q1 FY19. CDI expenses surged during the quarter under review, mainly on account of Ri-CoDIFY Phase 3 clinical trials of ridinilazole that has started in February 2019.
Summitâs investment related to the antibiotic pipeline development activities during the quarter under review stood at £0.7 mn against £0.2 mn in the year-ago period. This was mainly related to the preclinical development activities for SMT-571 and DDS-04 series.
Expenses incurred on Duchenne muscular dystrophy ('DMD') declined to £0.1 mn and reported a decline of £4.1mn on YoY basis, primarily because of, development of ezutromid discontinued in the June 2018. Other research and development related expenditure came down to £1.7 mn from £2.2 mn recorded in the corresponding period of the previous financial year.
Finance cost during the quarter under review stood at £0.1 mn against £0.2 mn recorded in the Q1 FY18. Pre-tax loss for Q1 FY19 was £4.9 mn as compared with £6.8 mn loss recognised in the first quarter of 2018. Net loss for the period under review was £4.0 mn against the Net loss of £5.8 mn recorded in the year-ago period. Basic Loss per share for the first quarter of FY19 stood at 3p per share vs 8p per share in the Q1FY18.
Cash Flows
Net Cash inflow during the quarter under review declined to £1.3 mn against the inflow of £7.2 mn in Q1 FY18. Net cash inflow from operating activities was £1.4 mn as compared with the outflow of £7.0 mn in Q1FY18. As on April 30, 2019, groupâs total cash and equivalents stood at £28.3 mn against £26.9 mn reported as on January 31, 2018.
During the first quarter of the FY19, the group started a clinical trials programme of RiCoDIFy Phase 3 in February, this year. Through this trial programme group aims to support ridinilazole adoption for the treatment of C.difficile infection.
A new class antibiotic SMT-571 was designed during the period to cure infections caused by Neisseria gonorrhoeae. The development of the new antibiotic was supported by an award of £4.5 mn from CARB-X.
In the exchange filing with the London Stock Exchange, Mr Glyn Edwards, CEO at SUMMIT Plc stated that â New antibiotics are getting criticised world over, but Summit team is innovating and producing a new series of antibiotics with the ability to mitigate the risk of the growing threat posed by the use of antibiotics.â Our new series of antibiotics have the potential to change the patient lives and its cost effective as well and with a unique selling strategy will achieve commercial success.â
Stock Information
At the time of writing as on June-13-19 (before the market close, at 08:41 AM GMT), shares of the SUMM were quoting at GBX 23.0 and trading flat against the previous day close price. At the current market price, the outstanding market capitalisation the company stood at £37.02 mn, which ranks it among the small-cap companies listed on the London Stock Exchange. Its shares are the constituent of the FTSE AIM All-Share and FTSE AIM All-Share -Healthcare index.
1-Yr Price Chart
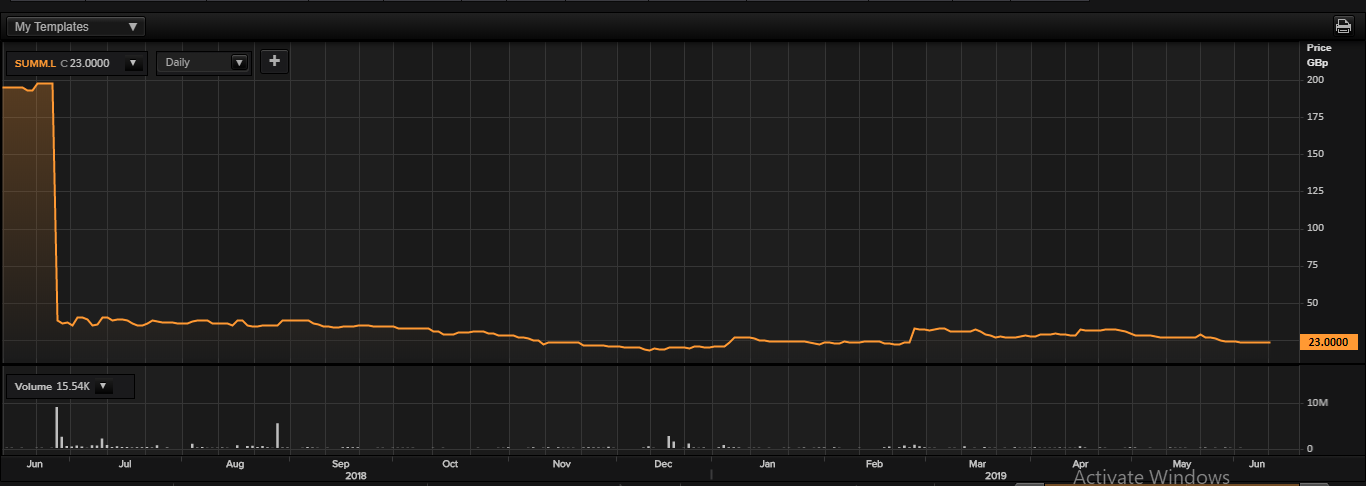
Daily price chart (as on June 13, 2019), before the market close. (Source: Thomson Reuters).
52-Wk High/Low
In the past 52wks, shares of the SUMM have registered a high of GBX 204.0 and a low of GBX 16.30, and at the current market price, as quoted in the price chart, shares were trading 88.7% below the 52w high price level and 41.1% above the 52w low price level. However, since June 05, 2019, the stock has traded flat against their respective previous closes.
Volume Summary
Today's volume in the stock stood at 67,000, and the 5-day average daily volume in the stock traded at AIM market of the London Stock Exchange stood at 9,185.80, which was approximately 77% below the 30-day average daily volume of 39,906.30 traded on the London Stock Exchange.
Price Performance
On a YoY basis, the stock was down by 88.2%. However, on a year-to-date basis, the stock was up by 17.95% but declined 23.3% in the past three months.
In the past year, the stock ended 44 times up, 82 times down and remain unchanged for 127 times against their respective previous day close. This indicates the stock is highly illiquid.
Simple Moving Average (SMA)
From the SMA standpoint, shares of the SUMM were trading considerably below the 200-day, 60-day and 30-day SMA prices, which is a bearish technical indicator and indicates that any near time recovery is tough.
Relative Strength Index (RSI)
From the RSI standpoint, 30-day, 14-day, 9-day and 3-day RSI stood at 38.15, 24.81, 18.0 and 3.5, which indicates the stock is into heavy oversold zone.
Bollinger Bands®20-day SMA of the stock stood GBX 24.65, the upper band stood at GBX 27.95, the lower band stood at GBX 21.3, and the current market price of the stock stood at GBX 23.0, which indicates that the stock is trending towards the lower Bollinger Bands® and could fall further from the current trading levels.
Volatility (Beta)
The stock is carrying a Beta of 1.27, which indicates the stock is relatively highly volatile against the benchmark index.
52wk P/E range
At the current market price, last twelve months (LTM) PE of the stock stood at 2.4x, whereas the stock has touched a 52 high PE of 3.8x and a 52w low PE of 2.0x.
The above discussed technical indicators reflect that the stock is in a steep downtrend and potential recovery in the near term looks too tough. Also, the liquidity is very low in the stock.
