


Different analysts and experts of the subject of the Transatlantic Trade and Investment Partnership (TTIP), have reportedly stated that the potential trade deal between the United States of America and the United Kingdom could become a significant hindrance in the growth story of Britain, as it would only lead to an economic expansion of 0.16 per cent in 15 yearsâ time. It was also pointed that if a trade deal is not negotiated by the British Administration with the European Union, it will lead to a contraction of the economy of up to 7.6 per cent in comparison with the existing trade arrangements that the country has. The following is a deeper look into the challenges of a trade deal with the United Kingdom:
Â
- British Health Norms and Standards â The United Kingdom has previously made it clear that the European Health and Environmental Norms will be considered a trade barrier, in case a trade deal is to be negotiated. This will largely impact the UK Packaged food industry, which has been following stringent measures of safety and health standards, and which US based vendors might not agree to.
- Regulations â A major aspect of the TTIP (Transatlantic Trade and Investment Partnership) has been regulatory concerns. It was previously stated by both parties that the regulatory bodies from both countries would review all the regulations together. Since then, it has become clear that there are major disagreements from both sides on various issues, and an agreement of regulatory commitments from both sides could be a challenge.
- Geopolitical Strategies â Itâs not a hidden fact that the UK and the USA have been natural allies since the first world war, and both seemed to have similar geopolitical objectives. But thereâs no hiding from the fact that both, 10 Downing Street and the White House have had major disagreements on some of the geographical issues, most recently, in the case of United Statesâ aggression towards Iran. It has been made clear from the United Statesâ side that if a trade deal is to be agreed between the two nations, the UK will have to align towards the USâ geopolitical objectives.
As per the office of the US Trade representative, currently, UK is the 7th biggest goods trading partner of the US with the trade for both sides amounting to US $127.1 billion. A potential trade deal could see an increase of approximately 40 per cent to this figure by the end of 2023 as per various experts.
Experts have also opined that the potential impact of such a deal with the US, without having the European Union to fall back on. Such reports have suggested that considering the fact that this would add only about 0.16 per cent to the UKâs economy over a period of next 15 years, a failure to agree a trade deal with the European Union would result in a contraction of the economy by 7.6 per cent as compared to the current trade policies of the UK, over the same 15 years period.
The UK obviously wants to be in trade with both EU and the USA after the transition period is over, and a free trade agreement (FTA) would be the most ideal scenario, but the challenges to achieving such scenario are too many, and there are currently many roadblock in the way, some of which have already been mentioned above.
A deal with the US is most likely to have an impact on the energy, banking and the healthcare sectors in the UK. The following is a brief outlook on the stock price performances of some companies, especially the ones who have significant existing trade activities in the United States of America.
Royal Dutch Shell Plc (LON:RDSA) Share Price Performance
As on 3rd March 2020, at 11:30 A.M (Greenwich Mean Time), by the time of writing this report, the Royal Dutch Shell Plc share was trading at a price of GBX 1766.00 per share on the London Stock Exchange market, an increase in the value of 2.91 per cent or GBX 50.00 per share, in comparison with the price of the share on the previous trading day, which had been reported to be at GBX 1716.00 per share. As of the time of reporting, the market capitalisation of Royal Dutch Shell Plc has been reported to be at a value of GBP 134.382 billion, with respect to the current trading price of the companyâs share.
It was also reported that the Royal Dutch Shell Plc share had given a negative return of around 24.91 per cent in value, in the previous one year, since March 04, 2019, when the share was trading at a price of GBX 2352.00 per share at the time of the close of the market. It was also reported that the companyâs share had given a negative return of around 22.53 per cent, in the last six months, in comparison with the share price of GBX 2279.50 at the time of the close of the market as on September 03, 2019. Royal Dutch Shell Plcâs share has been reported to have given a negative return of approximately 10.10 per cent, in the last one-month time from the share price of GBX 1964.40 per share that the share set as on February 03, 2020.
The beta of the share of the company has been calculated to be 1.08 by the time of writing this report.
HSBC Holdings Plc (LON:HSBA) Share Price Performance
As on 3rd March 2020, at 11:35 A.M (Greenwich Mean Time), by the time of writing this report, the HSBC Holdings Plc share was trading at a price of GBX 522.20 per share on the London Stock Exchange market, an increase in the value of 0.40 per cent or GBX 2.10 per share, in comparison with the price of the share on the previous trading day, which had been reported to be at GBX 520.10 per share. As of the time of reporting, the market capitalisation of HSBC Holdings Plc has been reported to be at a value of GBP 105.746 billion, with respect to the current trading price of the companyâs share.
It was also reported that the HSBC Holdings Plc share had given a negative return of around 15.50 per cent in value, in the previous one year, since March 04, 2019, when the share was trading at a price of GBX 618.00 per share at the time of the close of the market. It was also reported that the companyâs share had given a negative return of around 12.04 per cent, in the last six months, in comparison with the share price of GBX 593.70 at the time of the close of the market as on September 03, 2019. HSBC Holdings Plcâs share has been reported to have given a negative return of approximately 6.03 per cent, in the last one-month time from the share price of GBX 555.70 per share that the share set as on February 03, 2020.
The beta of the share of the company has been calculated to be at 1.05 by the time of writing this report.
AstraZeneca Plc (LON:AZN) Share Price Performance
As on 3rd March 2020, at 11:40 A.M (Greenwich Mean Time), by the time of writing this report, the AstraZeneca Plc share was trading at a price of GBX 7198.00 per share on the London Stock Exchange market, an increase in the value of 3.68 per cent or GBX 188.00 per share, in comparison with the price of the share on the previous trading day, which had been reported to be at GBX 7010.00 per share. As of the time of reporting, the market capitalisation of AstraZeneca Plc has been reported to be at a value of GBP 91.984 billion, with respect to the current trading price of the companyâs share.
It was also reported that the AstraZeneca Plc share had given a positive return of around 15.87 per cent in value, in the previous one year, since March 04, 2019, when the share was trading at a price of GBX 6212.00 per share at the time of the close of the market. It was also reported that the companyâs share had given a negative return of around 3.12 per cent, in the last six months, in comparison with the share price of GBX 7430.00 at the time of the close of the market as on September 03, 2019. AstraZeneca Plcâs share has been reported to have given a negative return of approximately 3.46 per cent, in the last one-month time from the share price of GBX 7456.00 per share that the share set as on February 03, 2020.
The beta of the share of the company has been calculated to be at 0.88 by the time of writing this report.
Comparative Share Price Chart of RDSA, HSBC and AZN
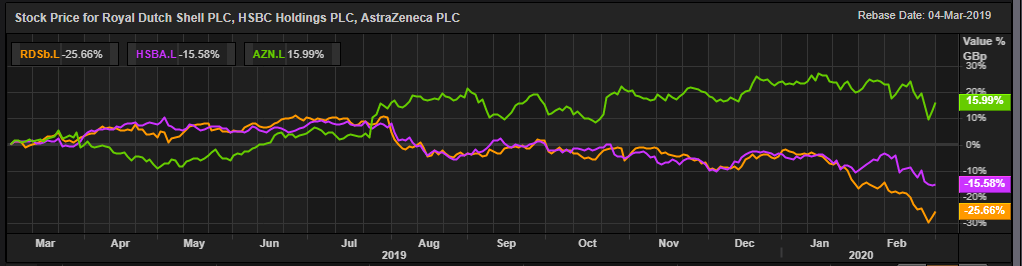
(Source: Thomson Reuters) Daily Chart as on 03-March-20, before the closing of the LSE Market