


International Consolidated Airlines
International Consolidated Airlines Group SA (IAG) is among the worldâs largest airline group headquartered in London, United Kingdom. The group has 573 aircraft carrying around 113 million passengers to 268 destinations each year. IAG is a market leader in three European countries i.e., Ireland, UK and Spain which enables it to gain the majority of share in the aviation market. The companyâs brand portfolio includes brands such as Aer Lingus, British Airways, Avios, Iberia, IAG cargo, Vueling and IAGGBS etc.
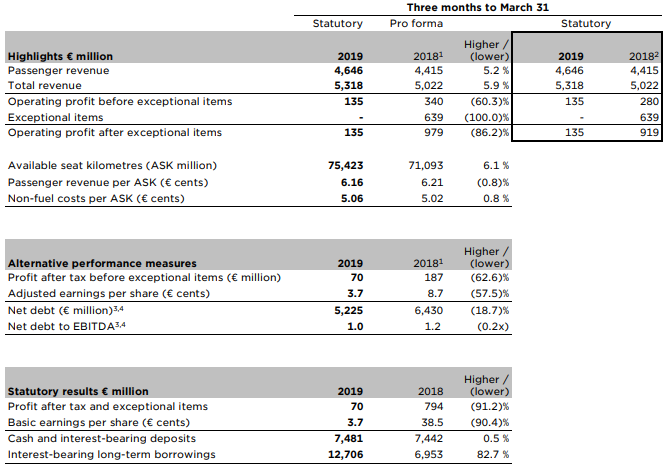
Financial Highlights (Q1 FY 2019, in â¬m)
(Source: Company Filings)
The company reported steady growth of both passenger revenue and other revenue, the reported total statutory revenue grew by 5.9% to EUR 5,318 million against EUR 5,022 million. The companyâs reported operating profit (before exceptional items) decreased by 51.79% in comparison with the last year to EUR 135 million largely due to a rise in the operating and administrative expenses during the quarter, led by fuel headwinds and fall in yields as a result of market capacity. Statutory operating profit (after exceptional items) weakened from EUR 919 million in Q1 FY2018 to EUR 135 million in Q1 FY2019. The companyâs Statutory reported pre-tax profit was EUR 86 million in Q1 FY2019 versus EUR 885 million in Q1 FY2018. The companyâs profit after tax (before exceptional items) declined by 62.57% to EUR 70 million in Q1 FY2019 against EUR 187 million in Q1 FY2018. The companyâs statutory profit after tax and exceptional items was EUR 70 million in Q1 FY2019 versus EUR 794 million in Q1 FY2018. The companyâs reported basic EPS was EUR 3.7 cents in Q1 FY2019 against EUR 38.5 cents in Q1 FY2018.
Share Price Commentary
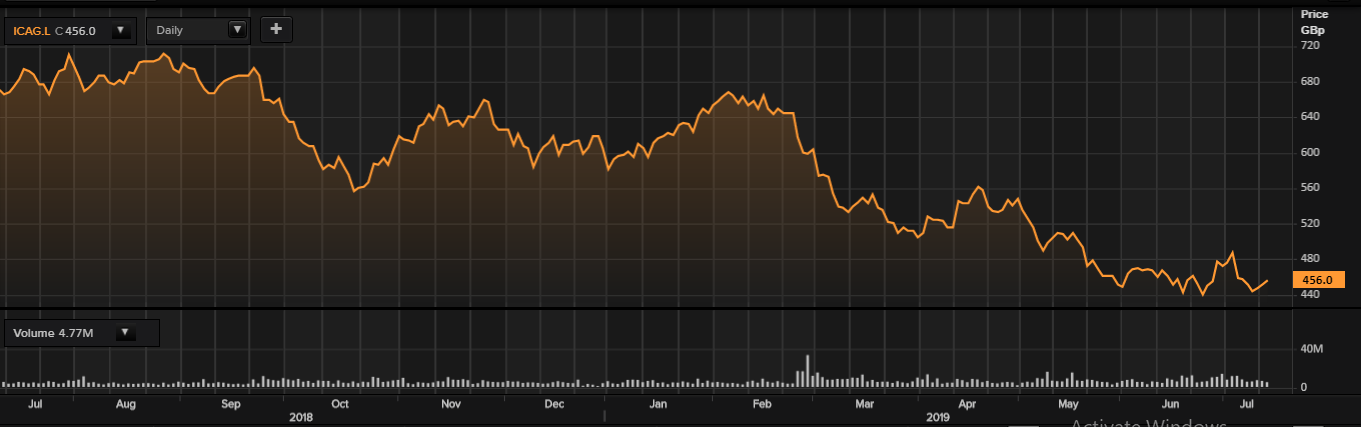
 Daily Chart as at July-12-19, after the market closed (Source: Thomson Reuters)
On 12 July 2019, IAG shares closed at GBX 456, up by 1.13% against the previous day closing price. Stock's 52 weeks High and Low is GBX 718.40/GBX 431.43. The companyâs stock beta was 0.73, reflecting less volatility as compared to the benchmark index. Total outstanding market capitalisation was £9.01 billion, with a dividend yield of 8.95 per cent.
Conclusion
After the website and mobile app of British Airways were hacked last year, the company has been fined £183m for breaching European data rules, which is one of the biggest and the first under new laws introduced in May 2018. The company remained profitable despite the impact on yield due to market capacity, foreign exchange headwinds and a rise in fuel costs. For the financial year 2019, the company expects passenger unit revenue to be flat at constant currency, and as non-fuel unit cost is likely to improve at constant currency, operating profit before exceptional items is expected to be in line with 2018 pro forma.
State Street Corporation
State Street Corporation (STT) is a Boston, United States-headquartered financial services company, listed on the New York Stock Exchange. The company differentiates its results in two segments, namely Investment Service and Investment Management.
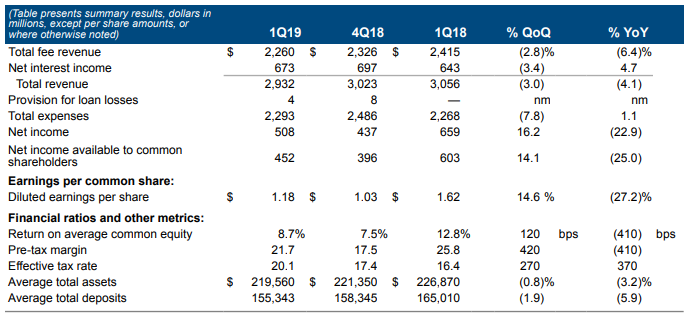
Financial Highlights (Q1 FY 2019, in $m)
(Source: Company Filings)
Due to weak average equity market level and challenging industry conditions including fee concessions and lower client activity and flows, fee revenue decreased by 6.4% as compared to 1Q18 to $2,260m, leading to a fall of 4.1% in total revenue to $2,932m. Reflecting higher US interest rates, net interest income grew by 4.7%. Driven by technology infrastructure spend and the impact of the Charles River Development acquisition, total expenses increased by 1.1% to $2,293m. Net income was $508m, which translated into diluted earnings per share of $1.18.
Share Price Commentary
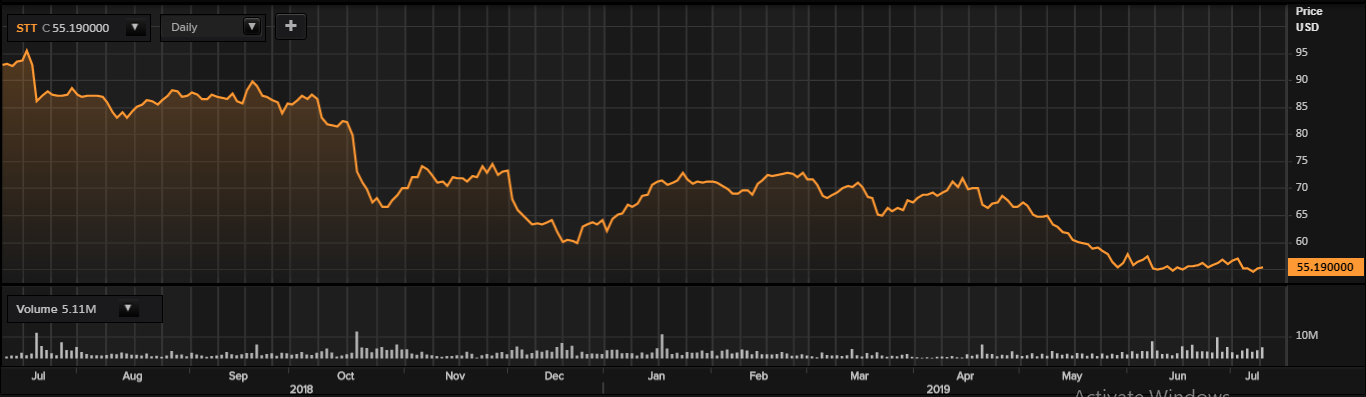
 Daily Chart as at July-12-19, after the market closed (Source: Thomson Reuters)
On 12 July 2019, STT shares closed at $55.19, up by 0.27 per cent against the previous day closing price. Stock's 52 weeks High and Low is $95.68/$53.53. The companyâs stock beta was 1.43, reflecting more volatility as compared to the benchmark index. Total outstanding market capitalisation was $20.59 billion, with a dividend yield of 3.41 per cent.
Conclusion
While the company focuses on better productivity, greater resource discipline and strengthening client relationships, the performance in the first quarter reflects the continued challenging condition as well as lower client activity. Considering this, market experts have downgraded the rating of the bank to underweight and warned of slowing global GDP and lower expectations of inflation. The Fed has been pushed to cut rates in 2019 and 2020 and jobs growth appears to be topping out, as wage growth decelerates.
Pirelli
Pirelli & C SpA (PIRC) is a Milan, Italy-headquartered multinational tyre company, listed on Milan Stock Exchange. It manufactures and markets tyres for a wide range of applications, including consumer and racing. It has a commercial presence in over 160 and operates 19 production plants in 12 countries. The companyâs operations are differentiated in six geographical segments: Europe, Russia and CIS, NAFTA, South America, Asia\Pacific (APAC), and Middle East\Africa\India (MEAI).
Financial Highlights (Q1 FY 2019, in EUR million)
Good performance in the high-end product range of the company helped to post an organic revenue growth of 1.2 per cent to EUR 1,313.8 million. Due to an improvement in product and channel mix, adjusted EBIT grew to EUR 219.2 million (EUR 218.4 million for the first quarter of 2018), with an adjusted EBIT margin of 16.7 per cent. Compared to EUR 92.4 million for the first quarter of 2018, net income related to continuing operations grew by 9.7 per cent to EUR 101.4 million.
Share Price Commentary
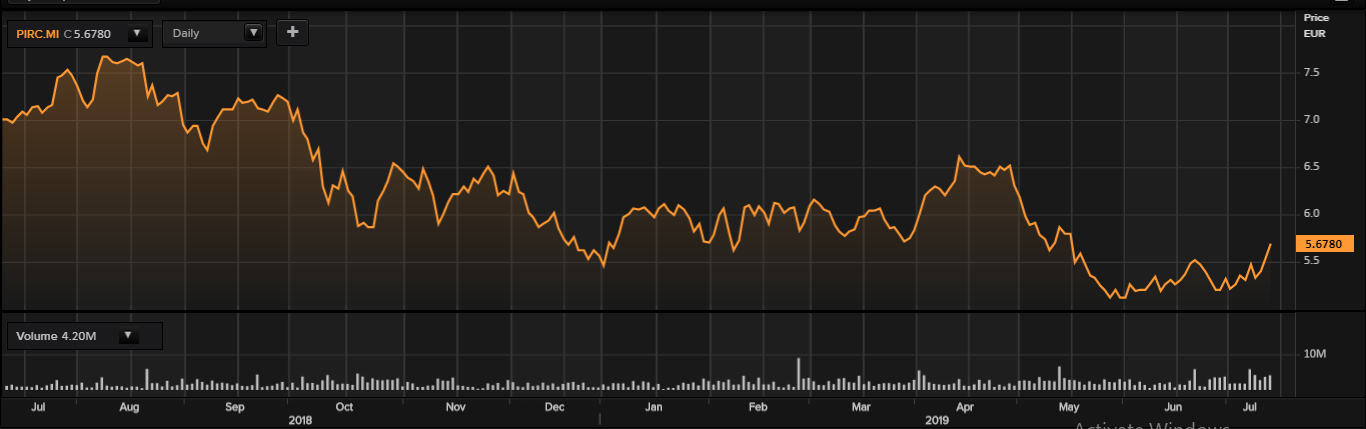
 Daily Chart as at July-12-19, after the market closed (Source: Thomson Reuters)
On 12 July 2019, PIRC shares closed at EUR 5.678, up by 2.94 per cent against the previous day closing price. Stock's 52 weeks High and Low is EUR 7.69/EUR 5.04. The companyâs stock beta was 0.92, reflecting slightly less volatility as compared to the benchmark index. Total outstanding market capitalisation was EUR 5.67 billion, with a dividend yield of 3.12 per cent.
Conclusion
Because of the sustained weakness of demand in Original Equipment, the company revised down its forecasts for revenue growth in 2019 from 4%-6% to between 3% and 4%. Compared with 18.4% in 2018, adjusted EBIT margin for the year is expected to be more than or equal to 19%. The ratio between Net Financial Position and Adjusted EBITDA (prior to start-up costs) is expected to be around 2.1x and investments in 2019 will be around EUR 400 million, consistent with the new market scenario. Recently, market experts upgraded the tyre maker from neutral to overweight with an â¬8 target price. The market is optimistic about the push by the company into high-value tyres, which would help it in posting an adjusted EBIT margin of more than 22%.
Inchcape
Inchcape PLC (INCH) is a London, United Kingdom-based automotive retailer and distributor. The group functions in around 32 national markets. The companyâs business is differentiated in three segments: Distribution, Retail and Central. The Distribution segment comprises geographical regions, such as the United Kingdom and Europe, Asia, Australasia, and Emerging Markets. The Retail segment comprises geographical regions, such as the United Kingdom and Europe, Australasia, and Emerging Markets. The company keeps relationships with a range of retail techniques, with Web responses, strategies, tailored social media campaigns and opportunities.
Financial Highlights (FY 2018, in £m)
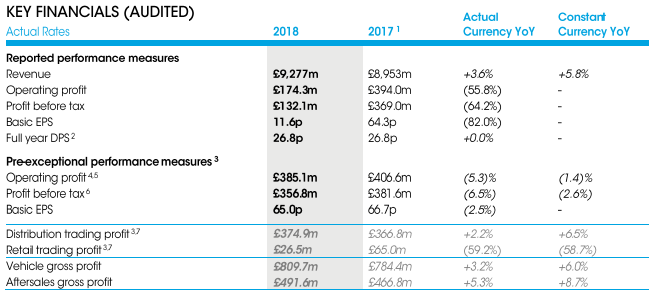
(Source: Company Filings)
Due to the growth in the emerging markets, reported revenue rose by 3.6% to £9,277 million, while on a constant currency basis, revenue surged by 5.8%. The operating profit before exceptional items declined by 5.3% to £385.1 million against the £406.6 million, while on a constant currency basis, operating profit before exceptional items declined by 1.4%. Reported profit before tax stood at £132.1 million, a decrease of 64.2% as compared to £369 million in FY17. On a constant currency basis, profit before tax (before exceptional items) declined by 2.6% to £356.8 million, due to the challenging retail trading environment and impact on margins. Adjusted basic earnings per share declined by 2.5% to 65p.
Share Price Commentary
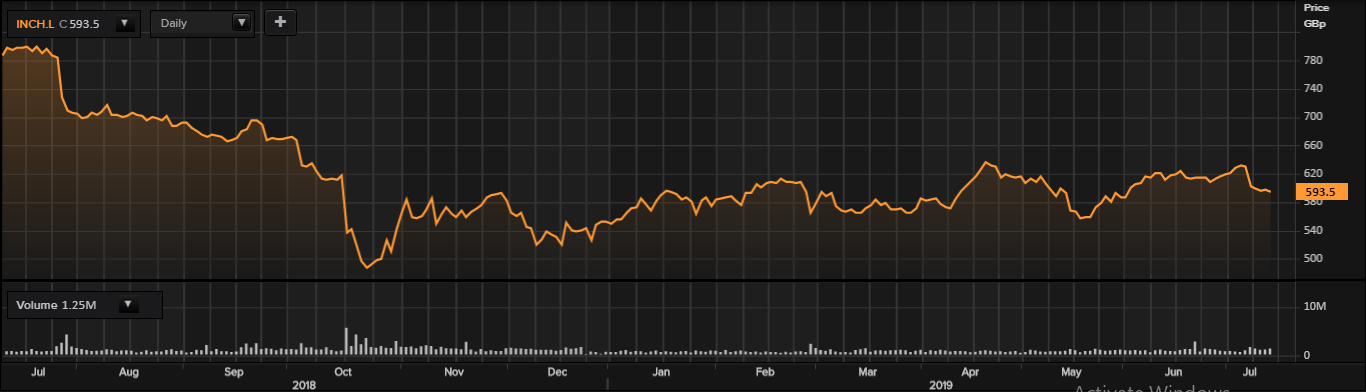
 Daily Chart as at July-12-19, after the market closed (Source: Thomson Reuters)
On 12 July 2019, INCH shares ended at GBX 593.5, down by 0.59 per cent against the previous day closing price. Stock's 52 weeks High and Low is GBX 826.00/GBX 482.20. The companyâs stock beta was 1.18, reflecting more volatility as compared to the benchmark index. Total outstanding market capitalisation was £2.43 billion, with a dividend yield of 4.52 per cent.
Conclusion
In the latest trading update (four months to Apr-30-19), the companyâs revenue increased by 3 per cent (actual currency) to £3.1 billion, while on a constant currency basis, revenue surged by 3%. Driven by a slowdown in the property market, the new car market was significantly impacted in Australia, which represents the biggest market for the company. The depreciation in the dollar against yen has also added strain on the next year earnings. Consequently, market experts recently downgraded the company from overweight to neutral with a target price of 627p.
