


There are no such investment products that can give a high return without any risk. The risk and returns are directly related to each other; higher the risk, higher the return. So, while selecting the investment, one must look at how much risk he can assume in order to get the desired result. We are going to talk about one of the financial products available in the market- Exchange Traded Funds and look at the general risk and return profile of such an investment.
Exchange Traded Funds (ETFs) are one of the most important and valuable products created for individual investors in recent years and offers many benefits if used wisely and is an excellent vehicle to achieve an investorâs goals.
What Are ETFs?
ETFs offer investors a way to channelize their money in a fund that takes positions in in bonds, stocks or any other financial asset or a combination of these assets. In return, the investor receives a return from the investment pool. ETFs do not exchange their underlying shares or sell shares directly to retail investors; instead, ETF units, derived from underlying assets are traded all through the day on national stock exchanges. They trade at market prices that may be the same or different from the NAV of the units.
History of ETFs:
- Exchange traded funds, or ETFs, were first developed in the 1990s to provide access to passive, indexed funds to individual investors;
- Since its inception, the ETF market has grown enormously, and they are now accessed by all types of investors and traders from around the world;
- ETFs now represent everything from broad market indices to niche sectors or alternative asset classes.
- Market ETFs:Designed to track an index like the S&P/ASX 200 or S&P/ASX 300;
- Bond ETFs:Designed to provide exposure to virtually every type of bond available;
- Sector and industry ETFs:Designed to provide exposure to an industry, such as oil, pharmaceuticals, or high technology;
- Commodity ETFs:Designed to track the price of a commodity, such as gold, oil, or corn;
- Style ETFs:Designed to track an investment style or market capitalization focus, such as large-cap value or small-cap growth;
- Foreign market ETFs:Designed to track non-Australian markets, such as Japanâs Nikkei Index or Hong Kongâs Hang Seng index
- Inverse ETFs:Designed to profit from a decline in the underlying market or index;
- Actively managed ETFs: Designed to outperform any index, unlike most ETFs, which are designed to track an index;
- Exchange-traded notes: Created to provide access to illiquid markets and have the added benefit of generating virtually no short-term capital gains taxes;
- Alternative investment ETFs:Innovative structures, such as ETFs that allow investors to trade volatility or gain exposure to a particular investment strategy, such as currency carry or covered call writing.
Advantages of ETFs
The appeal of ETFs to individual investors is:
- Buy and sell any time of the day: Mutual funds, in contrast, settle after the market close;
- Lower fees: There is no sales load, however, brokerage commissions do apply;
- More tax-efficient: Investors have better control over when they pay capital gains tax;
- Trading transactions: Because they are traded like stocks, investors can place a variety of orders (limit orders, stop-loss orders, buy on margin) which are not possible with mutual funds.
Disadvantages of ETFs
While superior in many respects, ETFs do have drawbacks, including:
- Trading costs: If you invest small amounts frequently, there may be lower-cost alternatives investing directly with a fund company in a no-load fund;
- Illiquidity: Some thinly traded ETFs have wide bid/ask spreads, which means youâll be buying at the high price of the spread and selling at the low price of the spread;
Tracking error: While ETFs generally track their underlying index well, technical issues can create discrepancies
Letâs look at five ETFs trading on ASX
iShares S&P 500 ETF (ASX: IVV)
Investment Objective
This ETF aims to track the investment results of an index created of large-cap U.S. equities. In the 2HFY18 this fund was adapted into an Australian domiciled iShares ETF, eliminating the need to complete U.S. tax forms known as âW8BENâ forms. The NAV as of 21st November 2019 stood at AUD 459.17 and the management fee of the ETF is 0.04%.
Exposure Breakdown
The ETF has its highest exposure in information technology, which comprises of 22.78% of the total weightage. Healthcare and Financial comprise about 13.94% and 13.06% respectively of the total weightage.
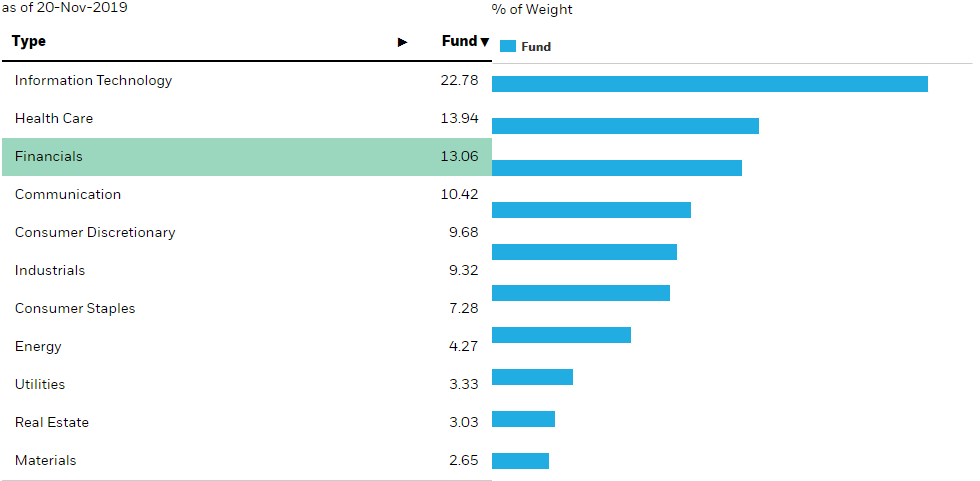
Exposure Breakdown (Source: Blackrock)
Performance
In last one year, the ETF has outperformed the benchmark index (S&P 500 Index). In one year, the ETF has given total returns of 17.18% whereas benchmark index has given total return of 16.89%. However, since inception the ETF has underperformed the benchmark index; the ETF gave a total return of 4.83% while the benchmark gave 4.88% return.
iShares S&P 500 (AUD Hedged) ETF (ASX:IHVV)
Investment Objective
The ETF seeks to offer investors with the market return, before fees and expenses but including the expenses related to hedging, as characterized by an index composed of large cap US stocks. The NAV as of 21st November 2019 stood at AUD 388.17 and the management fee of the ETF is 0.10%.
Exposure Breakdown
The ETF has its highest exposure in information technology, which comprises of 22.89% of the total weightage. Healthcare and Financial comprise about 14.00% and 13.12% respectively of the total weightage.
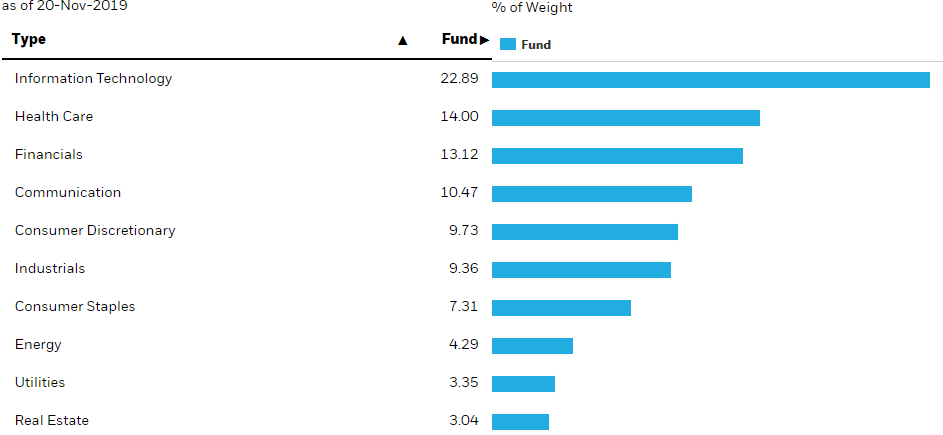
Exposure Breakdown (Source: Blackrock)
Performance
In last one year, the ETF has outperformed the benchmark index (S&P 500 Hedged AUD Index). In one year, the ETF has given total returns of 12.26% whereas benchmark index has given total return of 11.71%. And, since inception the ETF has outperformed the benchmark index; the ETF gave a total return of 11.27% while the benchmark gave 11.05% return.
iShares S&P Mid-Cap ETF (ASX:IJH)
Investment Objective
This ETF is designed to track the return of an index composed of mid-cap US equities. This fund gives low cost access to a specific segment of the US market and it can be used to diversify internationally and seek long term growth opportunities in the portfolio. The NAV as of 21st November 2019 stood at AUD 291.63 and the management fee of the ETF is 0.07%.
Exposure Breakdown
The ETF has its highest exposure in Financials sector, which comprises of 16.68% of the total weightage. Industrials and Information technology comprises about 16.67% and 15.61% respectively of the total weightage.
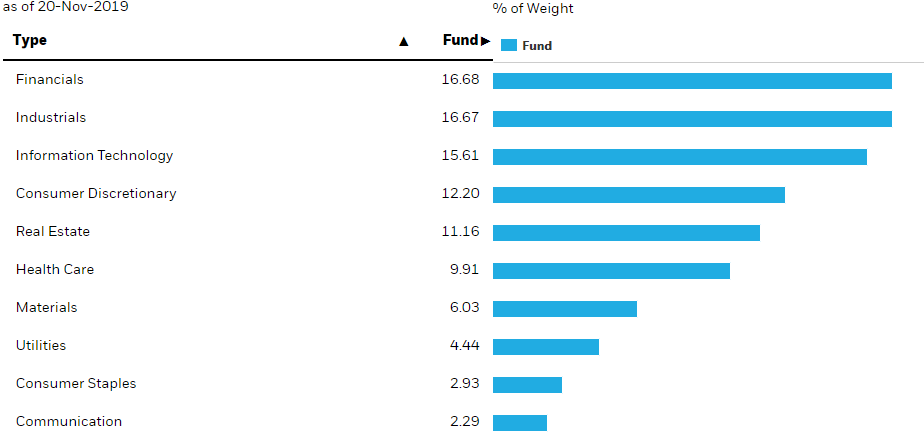
Exposure Breakdown (Source: Blackrock)
Performance
In last one year, the ETF has outperformed the benchmark index (S&P MidCap-400 Index). In one year, the ETF has given total returns of 11.82% whereas benchmark index has given total return of 11.57%. And, since inception the ETF has underperformed the benchmark index; the ETF gave a total return of 8.05% and the benchmark gave 8.14% return.
UBS IQ Morningstar Australia Quality ETF (ASX:ETF)
Description
The ETF seeks to imitate the performance of the Morningstar® Australia Moat Focus Indexâ¢, before fees and expenses, by keeping the shares within the underlying Index. Benefits of the funds include diversification, low cost, transparency and ease of access. The NAV as of 21st November 2019 stood at AUD 22.61 and the management fee of the ETF is 0.30%.
Exposure Breakdown
The ETF has its highest exposure in Financials sector, which comprises of 23.9% of the total weightage. Industrials and Real Estate comprises about 18.9% and 16.7% respectively of the total weightage.
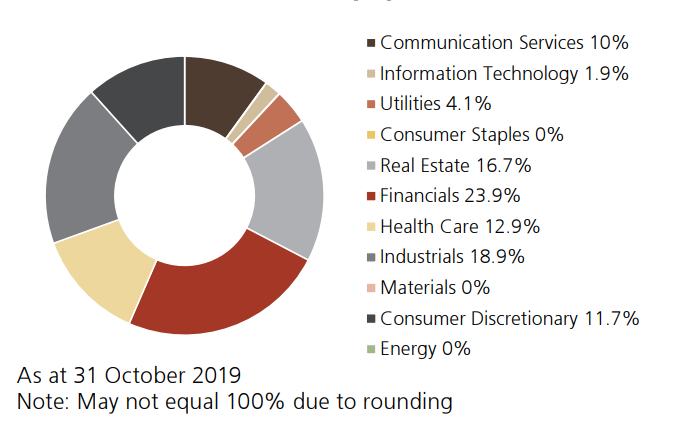
Exposure Breakdown (Source: UBS)
Performance
In last one year, the ETF has underperformed the benchmark index (Morningstar® Australia Moat Focus Indexâ¢). In one year, the ETF has given total returns of 20.77% whereas benchmark index has given total return of 21.18%. And, since inception the ETF has underperformed the benchmark index; the ETF gave a total return of 7.51% and the benchmark gave 8.04% return.
UBS IQ Morningstar Australia Dividend Yield ETF (ASX:DIV)
Description
The ETF intends to mimic the performance of the Morningstar® Australia Dividend Yield Focus Indexâ¢, before fees and expenses, by holding all the shares within the underlying Index. The NAV as of 21st November 2019 stood at AUD 22.85 and the management fee of the ETF is 0.30%.
Exposure Breakdown
The ETF has its highest exposure in Financials sector, which comprises of 26.3% of the total weightage. Industrials and Consumer Staples comprises about 21.6% and 21.6% respectively of the total weightage.
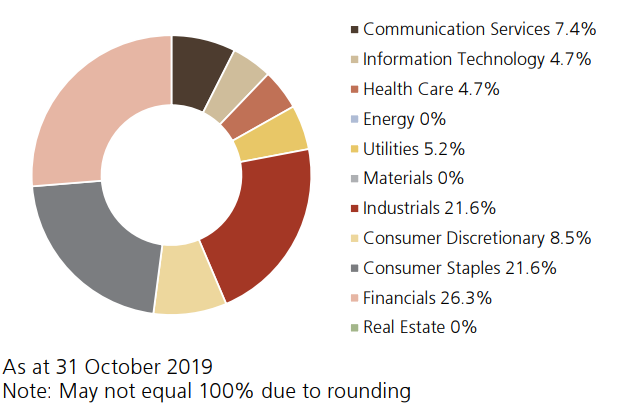
Exposure Breakdown (Source: UBS)
Performance
In last one year, the ETF has underperformed the benchmark index (Morningstar® Australia Dividend Yield Focus Indexâ¢). In one year, the ETF has given total returns of 24.38% whereas benchmark index has given total return of 25.00%. And, since inception the ETF has underperformed the benchmark index; the ETF gave a total return of 7.24% and the benchmark gave 7.79% return.
Disclaimer
This website is a service of Kalkine Media Pty. Ltd. A.C.N. 629 651 672. The website has been prepared for informational purposes only and is not intended to be used as a complete source of information on any particular company. Kalkine Media does not in any way endorse or recommend individuals, products or services that may be discussed on this site. Our publications are NOT a solicitation or recommendation to buy, sell or hold. We are neither licensed nor qualified to provide investment advice.
