AUS
AUS
 NZ
NZ
 UK
UK
 CA
CA
 USA
USA
 IND
IND

_07_03_2026_03_50_21_133108.jpg)



Summary
- Commodity market across the globe are showing a zig-zag movement with many whipsaws leaving investors with pocket cuts.
- The COVID-19 outbreak has disrupted the demand and supply equation of many commodities, leading to a non-normative movement and more susceptible to sentiment changes.
- After a brief plunge, is gold ready for the continuation of its primary bull trend, or is the oil market out of the woods yet? While such questions being at the top of the discussion list of many investors, the price action of such commodities are acting as a crystal ball, which if one knows how to read properly could navigate through these unprecedented times.
Commodity markets across the globe have witnessed a roller coaster ride with prices of many commodities such as Gold, Bitcoin, Iron ore showing a bull rally while commodities such as crude oil and base metals witnessing a plunge.
To Know More, Do Read: All That you need to know About Global Commodities Action in 2020, Hits and Misses
While the COVID-19 outbreak has disrupted the demand and supply equation for many commodities, a study of price action or the field of technical analysis could be used to navigate such volatile and unprecedented times.
Technical Analysis of Major Commodities & Crypto Currency
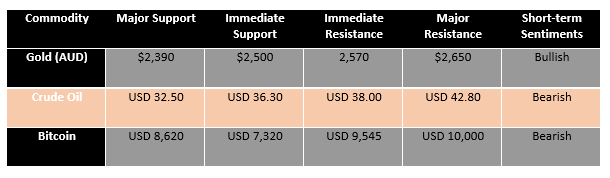
- Gold Spot Australian Dollar
Gold on a Daily Chart
XAUAUD Daily Chart (Source: EODHD/Others Eikon Thomson Reuters)
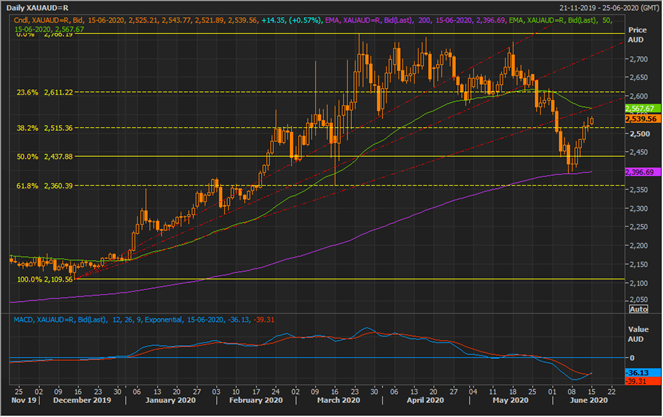
On following the daily chart, it could be seen that the gold spot has corrected more than 50 per cent of the primary rally, which started from ~ $2,109.00 and reached to a record high of $2,776.37 (as on 24 March 2020).
Post correcting over 50 per cent, the gold spot has again picked momentum with prices now reaching levels of $2,539.56 (as on 15 June 2020 5:23 PM AEST) and testing the 1/3 fraction of the Fibonacci fan projected by connecting the initial rally point to the record high.
The gold spot took the support around the 200-day exponential moving average after a 50.0 per cent correction, representing that the primary trend remains bullish. Furthermore, the 12,24,9 MACD indicator is now showing a positive signal.
However, the spot is currently trading below the 50-day EMA, reflecting on the short-term price correction or the secondary downtrend.
In future, if the prices breach the 1/3 fraction of the Fibonacci fan, which is a decisive resistance- as it is overlapping with the 50-day EMA, and confirms the breakout (sustains and closes above the breakout high for two consecutive trading session), it would mark the continuation of the primary uptrend and could further seed bullish sentiments.
XAUAUD Daily Chart (Source: EODHD/Others Eikon Thomson Reuters)
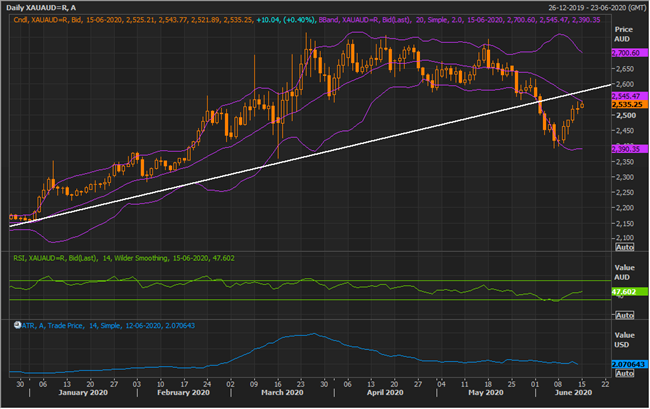
It should also be noticed that while the gold spot had broken down below the medium-term support line, currently gold is retracing back to the resistance line.
Furthermore, the gold spot took the support of the -1 Standard Deviation of the 20-day simple Bollinger band and did not confirm the volatility breakout post breaching the trendline support, which could also be noticed through the Average True Range, which remained relatively flat despite the trendline breach, confirming that the recent move was a specialist breakout.
At present, the gold spot is testing the mean value of the 20-day simple Bollinger band while the 14-day Relative Strength Index is taking a U-turn. A breach above the mean value of the Bollinger band with an above mean (50) RSI would again attract bulls to the market.
Also Read: Gold Slips Below USD 1,700 Per Ounce, ASX-Gold Stocks At the Brim of A Top
- Crude Oil
Crude oil on a Daily Chart
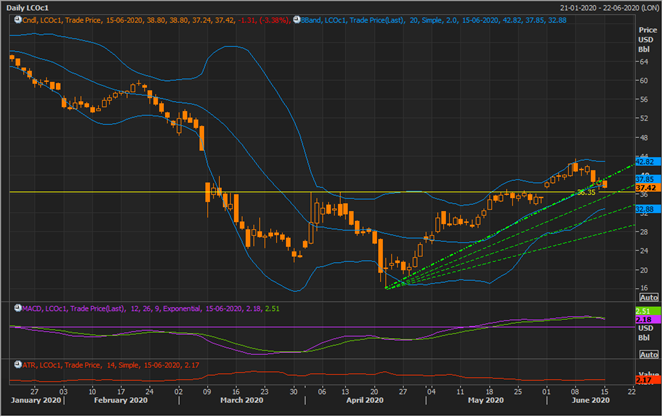
LCO Daily Chart (Source: EODHD/Others Eikon Thomson Reuters)
On following the daily chart, it could be seen that crude oil prices have breached the short-term resistance line of a primary downtrend, and filling the gap that was created in March, reflecting that the commodity has now entered the secondary trend (a short-term uptrend), which is currently testing its original breakout from USD 37.42.
On connecting the recent low with the recent high and projecting a Fibonacci fan, it could be seen that the commodity is now poised to test the 1/1 fraction of the Fibonacci, which would act as the primary support for the price- as it is coinciding with the horizontal support level of USD 37.42.
It should also be noticed that crude oil prices have given a breakdown below the short-term trendline, which is yet pending confirmation. Also, as the 1/1 fraction of the Fibonacci fan and the mean value of the 20-day simple Bollinger band are overlapping and it should be considered as a decisive support.
The major support for the oil price is at the 1/2 fraction of the Fibonacci fan, which is overlapping with the -1 SD of the Bollinger band.
The 12,24,9 MACD indicator is showing a negative signal, while the ATR is relatively flat.
Also Read: ASX-Listed Oil & Gas Stocks Show Massive Gap Downs; Is the OPEC Effort Going in Vain?
- Bitcoin
Bitcoin on a Daily Chart
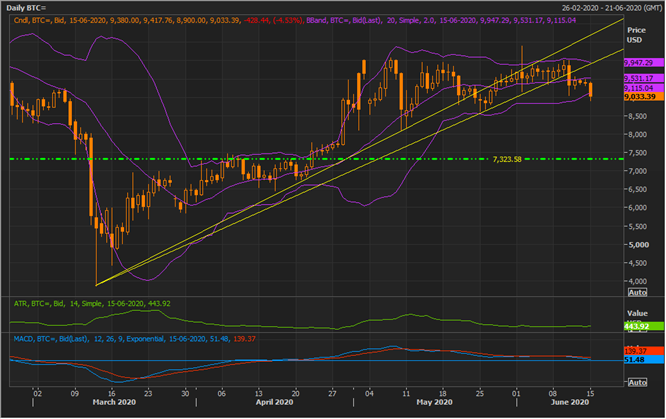
BTC Daily Chart (Source: EODHD/Others Eikon Thomson Reuters)
On following the daily chart, it could be seen that bitcoin prices have now breached its medium-term support zone (space between the two trendlines) and has also given a volatility breakout with prices breaching the -1 SD of the 20-day simple Bollinger band with a slight increase in the Average True Range, which could be an early indication of the change in the primary uptrend.
The 12,24,9 MACD indicator is also giving a negative signal, reflecting that the commodity is poised for entering the secondary trend. The major support for bitcoin is at USD 7,323.00.
Also Read: Bitcoin Gains Momentum Ahead of Halving Day Deadline; What Are Chartist Looking At?