
 AUS
AUS
 NZ
NZ
 UK
UK
 CA
CA
 USA
USA
 IND
IND







Source:Christian Vinces, Shutterstock
Copper futures has climbed the price ladder swiftly with the price now crossing the previous month top of $3.7338 per pound on COMEX. The price has hit $3.7735 per pound, establishing a new eight-year high.
The surge in copper prices has been primarily triggered by a supply squeeze on the global front, which is now providing a sentiment boost to many copper mining stocks.
As per the International Copper Study Group (ICSG), the global mine production has declined ~ 0.5 per cent during the first ten months of the year 2020, thanks to a considerable shrink in the output from one of the world’s top producing countries – Peru.
COVID-19 related restrictions and extreme weather conditions across Peru have taken a toll on copper production with mine output declining 14.5 per cent during the same period. Also, the decline in mine output across Peru peaked to 38 per cent during April-May 2020, which in turn, is now keeping the commodity price buoyant.
Furthermore, there has been a considerable shrink in copper inventory across China over higher operational rates, which is unprecedented as compared to the usual high inventory levels at the time of Lunar holidays. Currently, the Chinese copper inventory is estimated to be at a decade low.
Meanwhile, the copper miners across the globe are gaining considerable momentum over high demand and supply shortage of the underlying commodity.
NYSE-listed Copper Behemoths
Southern Copper Corporation (NYSE:SCCO)
SCCO is one of the world’s largest copper producers with a significant reserve in the industry and a market capitalization of $33.3 billion. In 2020, the Company refined about 783,349 tonnes of copper, 12.6 million ounces of silver, and 104,977 tonnes of zinc.
It is 88.9 per cent owned by Grupo Mexico – one of the world’s largest Mexican copper producers.
The stock of the Company has been trailing higher and higher with every uptick in copper prices and has now reached a new record high of $73.19 (as on 9 February 2021).
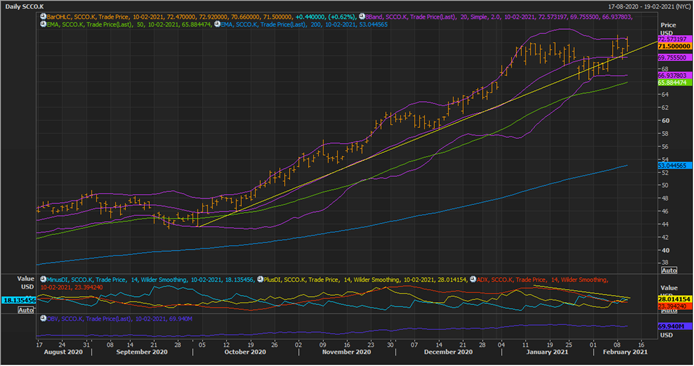
SCCO Daily Price Chart (Image Source: EODHD/Others Eikon Thomson Reuters)
On following the daily chart, it could be seen that SCCO has been in an uptrend for quite a while with prices trailing above the 200- and 50-days exponential moving averages.
- At present, the stock is trading at the long-term upward sloping trendline, which might act as primary support for prices. A break and price action below the same might seed bearish sentiments over the short-term. While establishing a new record, SCCO gave a volatility breakout with prices breaching the +2 Standard Deviation of the 20-day simple Bollinger Band®.
- However, bulls were unable to sustain the same, and the price corrected to test the support line. The record high price should act as an immediate resistance point for the stock, and a break and price action above the same could seed bullish sentiments ahead.
- The technical indicators are moving in tandem with the price action, except the average directional index, which is showing a slight divergence with the price action. A divergence in ADX at top could be an early signal of a trend reversal.
Freeport-McMoRan Copper & Gold Inc (NYSE:FCX)
Just like Southern Copper, FCX has also gained a considerable momentum in the recent past with prices climbing from $8.60 (intraday low on 22 May 2020) to the present high of $32.35 (as on 9 February 2021), marking a price appreciation of ~ 276.16 per cent.
FCX is also one of the largest copper producers across the globe and is also working on the Lone Star leach project in Arizona, the production at the prospect is anticipated to commence from this year. Once ramped up, the project would add ~ 90,718 tonnes of copper per annum to the overall portfolio of the Company.
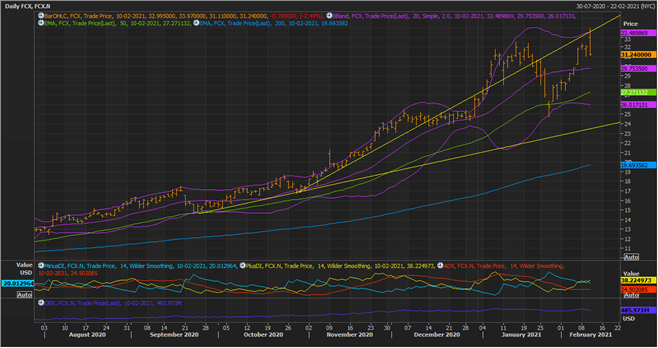
FCX Daily Price Chart (Image Source: EODHD/Others Eikon Thomson Reuters)
On following the daily chart, it could be seen that FCX has been trading in an uptrend with prices trailing above 200- and 50-days exponential moving averages. The stock has now tested the resistance line (upward sloping yellow line) and is currently facing the hurdle around the same level.
- The top yellow resistance line, which is overlapping with the +2 Standard Deviation of the 20-day simple Bollinger Band® should act as immediate and decisive resistance ahead. A break and price action above the same could seed bullish sentiments.
- On the flip side, the support level is widening from the resistance level, thanks to the large price moves. The immediate support for the stock is at the mean value of the Bollinger Band®, followed by a primary support at -2 Standard Deviation.
