


Lloyds Banking Group PLC (LON:LLOY)
London, United Kingdom-based, Lloyds Banking Group PLC is a financial services group. The company provides banking and financial services and insurance, focused on corporate and retail clients.
LLOY-Recent News
The group, along with some other financial institutions, has been subjected to stress test by the Bank of England (BoE) in the United Kingdom for the financial year 2019 on 16th December 2019. The group CET1 ratio was 8.5 per cent, and its leverage ratio was 4.3 per cent, which was well above the hurdle rates of 7.5 per cent and 3.47 per cent.
The companyâs capital position remains robust as on 30th September 2019. The company is expected to announce its results for 2019 on 20th February 2020. The stress test scenario combines an increase in unemployment and interest rates, combining the fall in GDP and property prices.
LLOY-Business performance for the three-month period ended 30th September 2019
The groupâs underlying profit was £6,016 million for the three-month period ended 30th September 2019 against £6,303 million recorded in the same period of the previous financial year, as a result of lower net interest income earned.
The statutory profit post-tax slumped substantially by 47 per cent to £1,987 million, primarily driven by a significant surge in the payment protection insurance provision, which stood at £2,450 million against £550 million reported in the year-over period.
The groupâs Net Interest Income declined by 3 per cent to £9,275 million during the period under review in comparison to £9,544 million it reported in a year-ago period due to the challenging businesses environment primarily driven by Brexit.
The group has made robust growth from the strategic point of view and provided strong financial performance in a very challenging external environment in the nine-month period ended in 2019.
The statutory result was substantially affected by the additional PPI charge in the third quarter of the fiscal year 2019. However, the companyâs performance stays in showing the resilience of the client franchise and business model with a robust balance sheet.
LLOY-Stock price performance
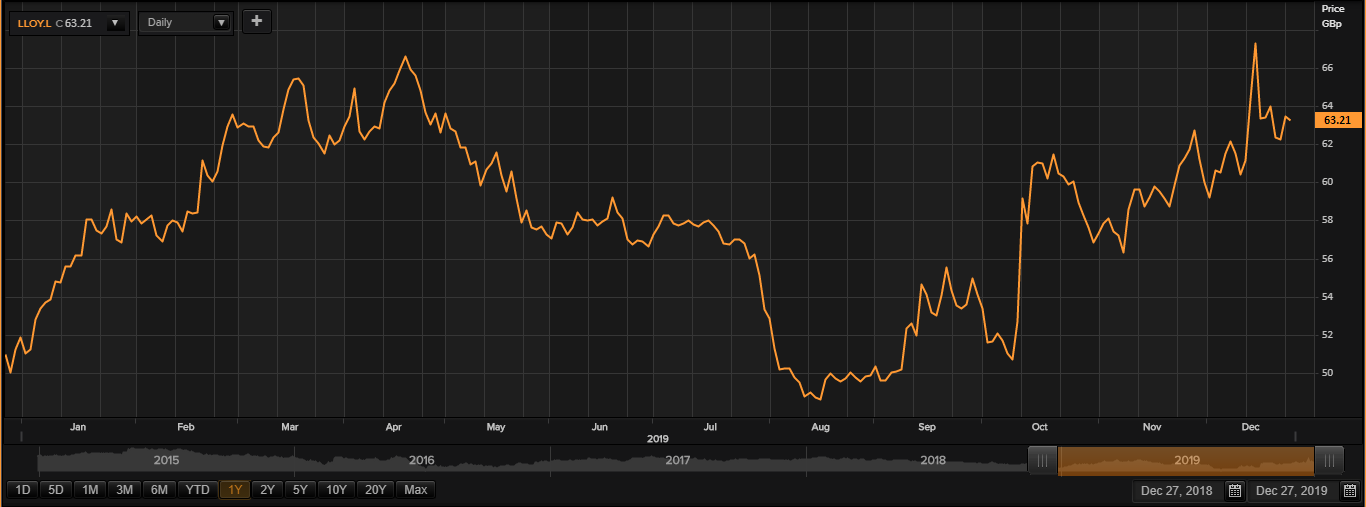
Daily Chart as at December-27-19, before the market close (Source: Thomson Reuters)
On 27th December 2019, at the time of writing (before market close, GMT 10:01 AM), Lloyds Banking Group PLCâs shares were trading at GBX 63.21, down by 0.33 per cent against its previous day closing price. Stock's 52 weeks High and Low is GBX 73.66/GBX 48.16. At the time of writing, the share was trading 14.19% lower than its 52w High and 31.25% higher than its 52w low. Stockâs average traded volume for 5 days was 167,195,136.60; 30 days - 190,568,207.23 and 90 days - 180,128,987.62. The average traded volume for 5 days was down by 12.26% as compared to 30 days average traded volume. The companyâs stock beta was 0.72, reflecting lower volatility as compared to the benchmark index. The outstanding market capitalisation was around £44.42 billion.
Barclays PLC (LON:BARC)
London, the United Kingdom-headquartered, Barclays PLC offers products and financial services as well as investment banking, with an objective of generating sustainable returns for shareholders. The business divisions of the group are segregated in three operating segments, namely Head Office, Barclays UK, and Barclays International.
BARC-Recent News
The group released the stress test outcomes conducted by the Bank of England on 16th December 2019 for the United Kingdom banks.
The group cleared the stress test, which factored tactical management actions, it comprised of CRD IV distribution restrictions with a minimum of 8.9 per cent transitional CET1 ratio.
Therefore, the company exceeded 8.1 per cent of stress test hurdle rate. The company will release its full-year results for 2019 on 13th February 2020.
BARC-Business performance for the third quarter period ended 30th September 2019
In the third quarter of 2019, the companyâs cost to income ratio stood at 62 per cent and remained flat against the third quarter of 2018.
The groupâs PBT (profit before taxation) without factoring conduct and litigation was recorded £3.3 billion for the third quarter of 2019 in contrast to £3.1 billion recorded in the third quarter of 2018.
The PBT (profit before taxation) from Barclays UK in the third quarter of 2019 was £0.4 billion as compared to £1.6 billion recorded in the third quarter of 2018.
The company also made an additional provision in the third quarter of 2019 of £1.4 billion for Payment Protection Insurance (PPI). The companyâs tangible net asset value (TNAV) was reported at 274 pence per share at the end of the third quarter of 2019.
On a sustainable basis, the company continues to boost returns while investing in key business growth initiatives and providing attractive capital returns to investors. It expects to reduce 2019 costs below the original target of £13.6 billion, reflecting the continued investment in the business.
BARC-Stock price performance
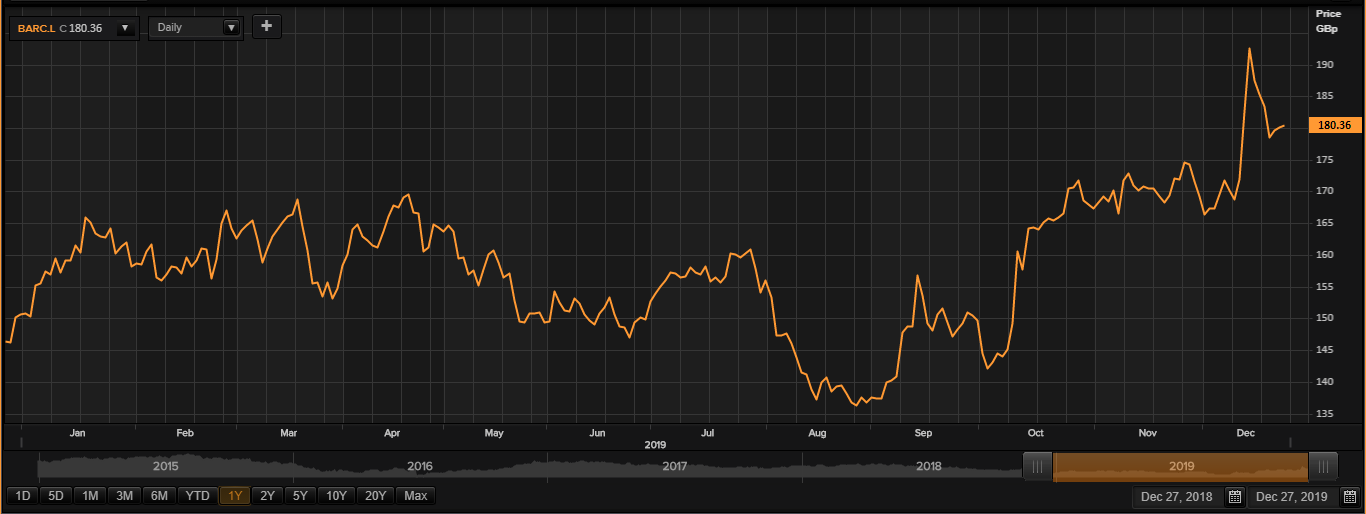
Daily Chart as at December-27-19, before the market close (Source: Thomson Reuters)
On 27th December 2019, at the time of writing (before market close, GMT 10:17 AM), Barclays PLCâs shares were trading at GBX 180.36, up by 0.20 per cent against its previous day closing price. Stock's 52 weeks High and Low is GBX 192.99/GBX 131.04. At the time of writing, the share was trading 6.54% lower than its 52w High and 37.64% higher than its 52w low. Stockâs average traded volume for 5 days was 49,633,409.40; 30 days - 42,454,289.57 and 90 days - 44,206,611.33. The average traded volume for 5 days was up by 16.91% as compared to 30 days average traded volume. The companyâs stock beta was 0.83, reflecting lower volatility as compared to the benchmark index. The outstanding market capitalisation was around £31.17 billion.
Vodafone Group Plc (LON:VOD)
Headquartered in the United Kingdom, Vodafone Group Plc is a telecommunication company. It provides a range of services including mobile communication, fixed communication, unified communication, internet of things (IoT), cloud hosting and security & carrier services. The company is mainly operating in two geographies, AMAP (Africa, the Middle East and the Asia Pacific) and Europe which comprise of 24 countries.
VOD-Recent News
Monaco Telecom will acquire VFML (Vodafone Malta) for a cash consideration of â¬250 million. On 19th December 2019, Vodafone Group announced the signing of an agreement with Monaco Telecom (Monaco Telecom SAM) to sell 100 per cent of VFML.
VOD-Financial Highlights for H1 Financial Year 2020 (30 September 2019, â¬, million)
The companyâs reported revenue surged by 0.4 per cent to â¬21.9 billion in the first half of the financial year 2020 as compared with the corresponding period of the last year, due to the benefits derived from the acquisition of Liberty Global's assets in Central & Eastern Europe and Germany.
Groupâs service revenue surged by 1.5 per cent to â¬18.5 billion in the first half of the fiscal year 2020 against the â¬18.3 billion in the first half of the fiscal year 2019, while organic adjusted EBITDA was up by 1.4 per cent. The loss after taxation (LAT) for the first half of the fiscal year 2020 period stood at â¬1.9 billion. Basic loss per share was reported at 7.24 cents in the first half of the fiscal year 2020 versus 28.89 cents in the first half of the fiscal year 2019, while adjusted earnings per share stood at 0.85 cents in the first half of the fiscal year 2020.
In most of the major European markets, the company has now secured network sharing agreements. The company released a key long-term wholesale collaboration with Virgin Media in the United Kingdom, in order to enhance the use of the network assets.
VOD-Stock price performance
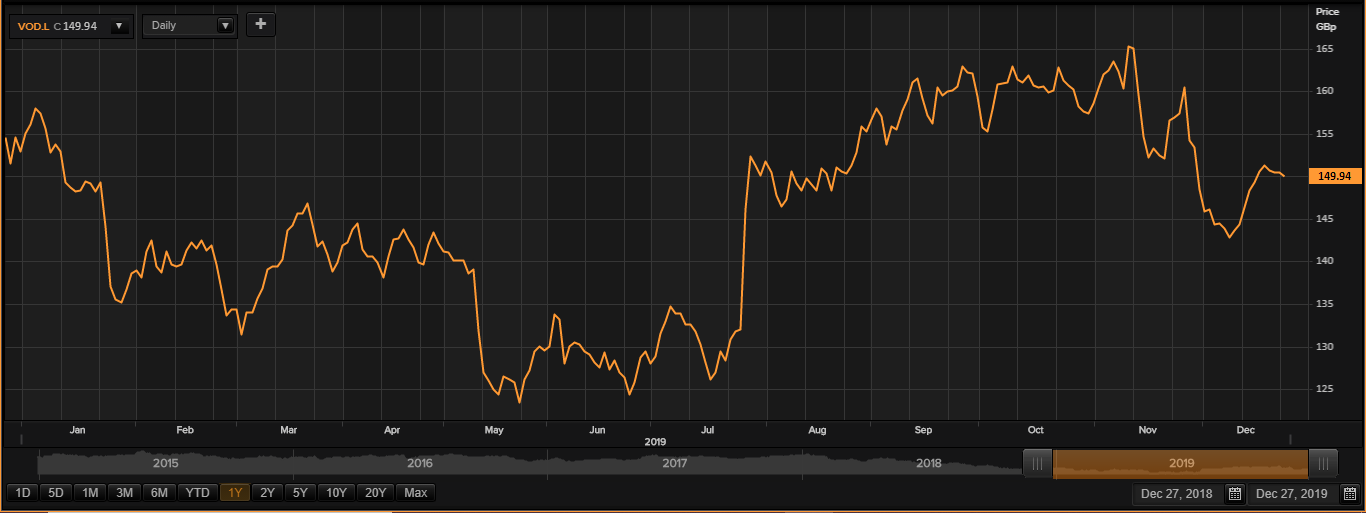
Daily Chart as at December-27-19, before the market close (Source: Thomson Reuters)
On 27th December 2019, at the time of writing (before market close, GMT 10:20 AM), Vodafone Group Plcâs shares were trading at GBX 149.94, down by 0.31 per cent against its previous day closing price. Stock's 52 weeks High and Low is GBX 169.46/GBX 122.22. At the time of writing, the share was trading 11.52% lower than its 52w High and 22.68% higher than its 52w low. Stockâs average traded volume for 5 days was 45,525,611.60; 30 days - 77,766,723.90 and 90 days - 66,644,772.61. The average traded volume for 5 days was down by 41.46% as compared to 30 days average traded volume. The companyâs stock beta was 1.11, reflecting higher volatility as compared to the benchmark index. The outstanding market capitalisation was around £40.26 billion.
