
.jpg)
_05_16_2023_17_11_27_393572.jpg)


Applied Graphene Materials
Applied Graphene Materials Plc (AGM) is an AIM-listed company which provides a wide range of applications with custom graphene dispersions and formats. The group is capable of high-volume graphene nanoplatelets using a continuous process, and the company owns the know-how and intellectual property behind these processes, giving it a competitive advantage. Three main segments which the group targets are - coatings, composites and polymers plus functional fluids.
Financial Highlights (H1 FY 2019, in £m)
While revenue for the period ended 31 January 2019 was GBP 26,000 (2018: GBP 54,000), other income, which comprises grant income, was GBP 23,000 (2018: GBP 30,000). Against a loss on ordinary activities before tax of GBP 2,291,000 in the first half of FY 2018, a loss of GBP 2,374,000 was recognised in FY 2019. Due to ongoing costs associated with the technical input provided to commercial partners and increase in day to day costs of the business, EBITDA for the group for the period increased to a loss of GBP 2,233,000 from a loss of GBP 1,952,000 in 2018. While adjusted basic loss per share was 4.4p per share (2018: loss of 5.8p per share), basic loss per share was 4.4p per share (2018: loss of 6.4p per share). No dividend was proposed for the period and net cash used in operations was GBP 2,173,000.
Share price performance
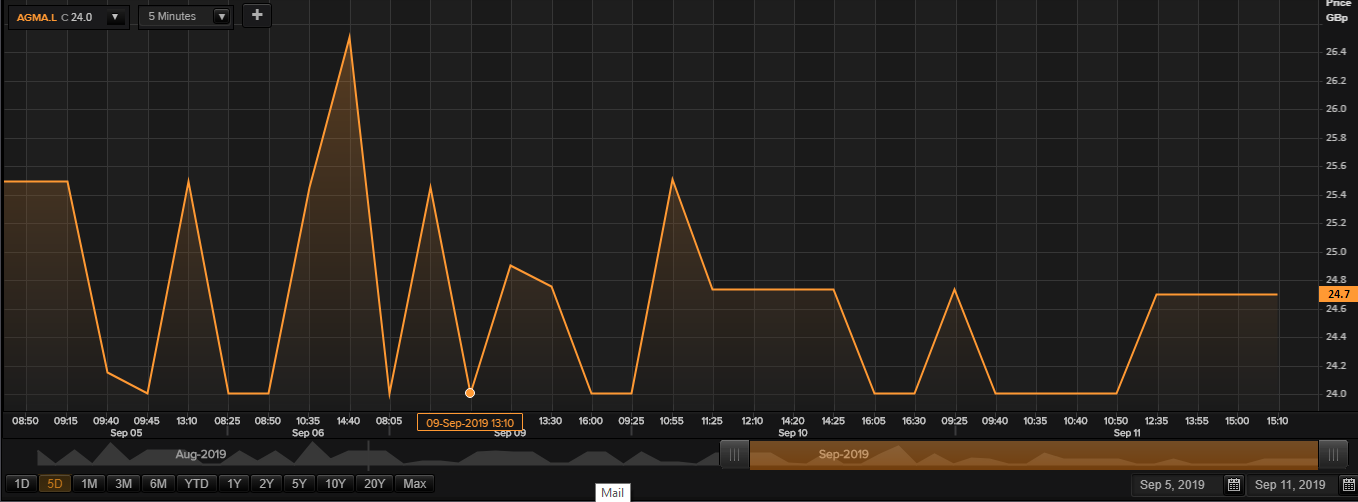
Daily Chart as at 11-September-19, before the market close (Source: Thomson Reuters)
On 11th September 2019, at the time of writing (before the market close, GMT 3:30 PM), AGM shares were trading at GBX 24.7. Stock's 52 weeks High and Low are GBX 48.80/GBX 22.60.
Ilika PLC
Ilika PLC (IKA) is a United Kingdom-headquartered company which invents new materials for energy and electronics markets to meet the specific demands of a wide range of applications. The company has operations in the USA, China and Japan and its development teams collaborates with global brands such as Rolls Royce and Toyota. The company has developed solid-state battery technology, which is now licensed to partners for the Internet of Things sensors around the world.
Recent News
As the company is a pioneer in developing solid-state battery technologies, the company received further funding of £0.9 million for the project called âGraniteâ. This project has partnered with the likes of Jaguar Land Rover to develop batteries for future electric vehicles.
Financial Highlights for FY19
Since the activities of the company are supported by grants, the majority of turnover is dominated by grants for projects undertaken by the group. The grant income recognised from ten projects that the company has in progress was £2.2m, helping the company to report an annual turnover of £2.6m (2018: £2.1m). Due to increased direct costs as a result of an increased level of commercial and grant-supported programmes, combined cost of sales and administrative expenses were £5.0m in the year which was up from the £4.9m for 2018, despite a slight fall in administrative costs. Loss on continuing activities before tax reduced from £3.3m in FY 2018 to £2.7m in FY 2019 reflecting lower share-based payment charge together with the improved margin, while net assets amounted to £5.9m at 30 April 2019 (2018: £3.8m).
IKA-Share price performance
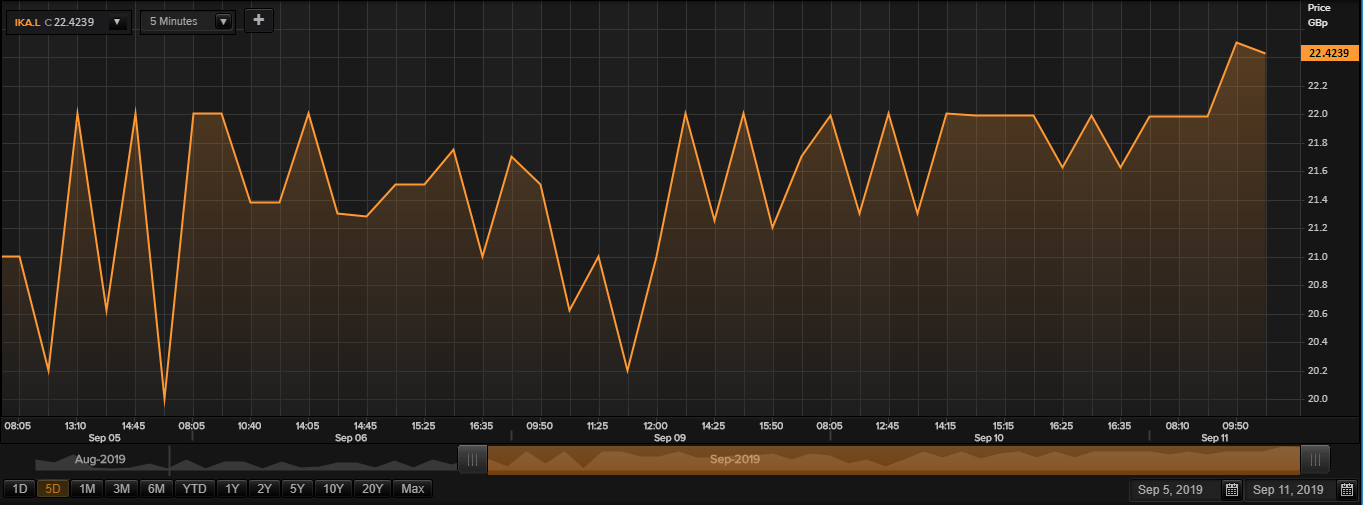
Daily Chart as on 11-September-19, before the market close (Source: Thomson Reuters)
On 11th September 2019, at the time of writing (before the market close, GMT 3:35 PM), IKA shares were trading at GBX 22.42. Stock's 52 weeks High and Low are GBX 40.00/GBX 11.25.
Â
Frontier IP Group Plc (FIPP)
Frontier IP Group Plc (FIPP) is a British company focused on commercialisation of intellectual property (IP). The company operates in various sectors including materials, energy, healthcare, information technology and life sciences.
Recent News
N+1 Singer Advisory LLPÂ has been appointed as the only authorised broker for the company with effect from 10th September 2019.
FIPP-Financial Highlights for H1 FY19 period ended 31st December 2018
The companyâs (reported) revenue was £2,176 thousand in H1 FY19. In the H1 FY2019, the profit from operations was recorded at £1,237 thousand. The companyâs profit before taxation was recorded at £1,247 thousand in H1 FY19. The companyâs basic earnings per share stood at 3.18 pence in H1 FY19. The companyâs diluted earnings per share for H1 FY19 stood at 3.03 pence as against 1.13 pence in H1 FY18. Cash balances of the company were recorded at £2,528 thousand in H1 FY19.
FIPP-Share price performance
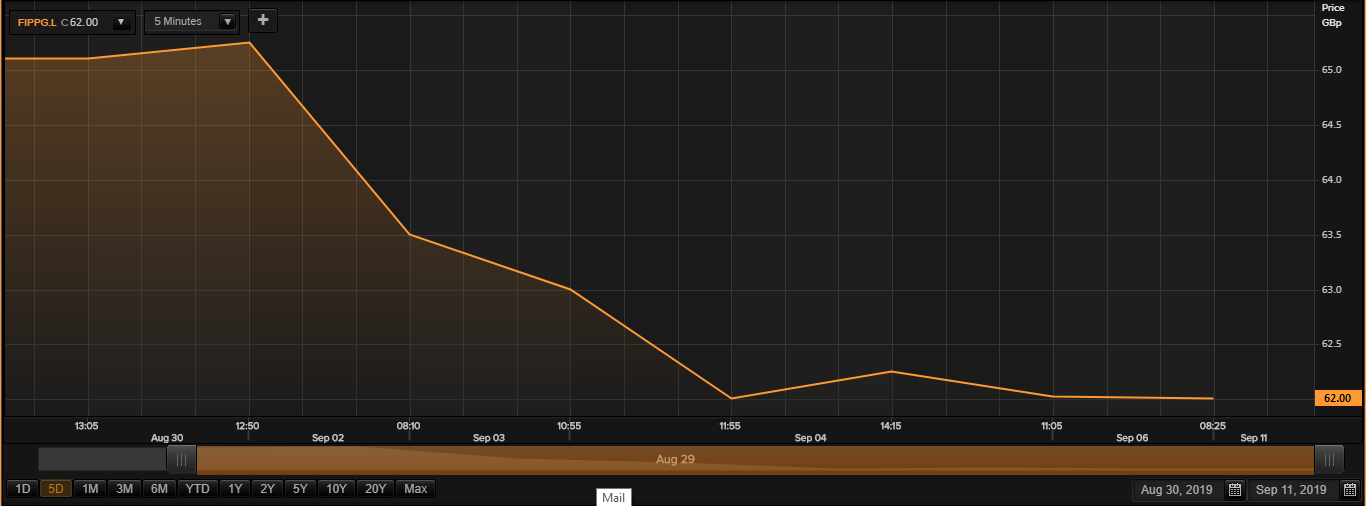
Daily Chart as on 11-September-19, before the market close (Source: Thomson Reuters)
On 11th September 2019, at the time of writing (before the market close, GMT 3:38 PM), FIPP shares were trading at GBX 62. Stock's 52 weeks High and Low are GBX 89/GBX 53.
Â
Cabot Energy Plc
Cabot Energy Plc (CAB), formerly known by the name Northern Petroleum, is an independent upstream oil and gas company. The group explores, produces, and develops oil and natural gas; and trades assets. The company operates in onshore and offshore projects, including gas producing fields and oil fields. Cabot's operational assets are in Canada, Italy, French Guiana, and Australia. Trading Update Q2 FY2019
On 20th August 2019, Cabot Energy Plc provided a Q2 and H1 update ending June 30th, 2019. The companyâs production (gross-averaged) was 485 bopd (barrels of oil per day) versus 761 bopd in H1 FY2018. The production (gross-averaged) in Q2 FY2019 was 459 bopd versus 781 bopd in Q2 FY2018. The decline in the production was due to deferred production and decline in field and wells for the period. The companyâs sales volumes in H1 FY2019 was 87,555 bbls against 139,632 bbls in H1 FY2018. The sales volumes in Q2 FY2019 was 41,284 bbls against 73,021 bbls in Q2 FY2018. Edmonton Light Oil sales price declined to US$46/bbl in H1 FY2019 from US$52.83/bbl in H1 FY2018. Cabot's Canadian operations are at cash flow break-even based on the crude oil sales prices for the month of June 2019. The companyâs licences in Italy had been suspended due to signing of a decree by the Italian Government, the company is evaluating its Italian portfolio to prioritise The Sicily Channel, and The Adriatic based offshore opportunities.
Financial Highlights for FY18
The companyâs Canadian crude oil revenues surged by 154 per cent to $12.2 million as compared with the financial year 2017 of $4.8 million. Groupâs EBITDA improved from a loss of $2.6 million in 2017 to a loss of $2.4 million in 2018, while adjusted EBITDA (adjusting for nonrecurring and exceptional items), improved from a loss of $2.4 million in FY17 to a profit of $0.1 million in 2018. The companyâs operating loss for FY2018 was at $5,996 thousand versus an operating loss of $3,741 thousand in FY2017. The loss before tax stood at $6.2 million for the year. Basic and diluted loss per share stood at 0.9 cents.
Share price performance
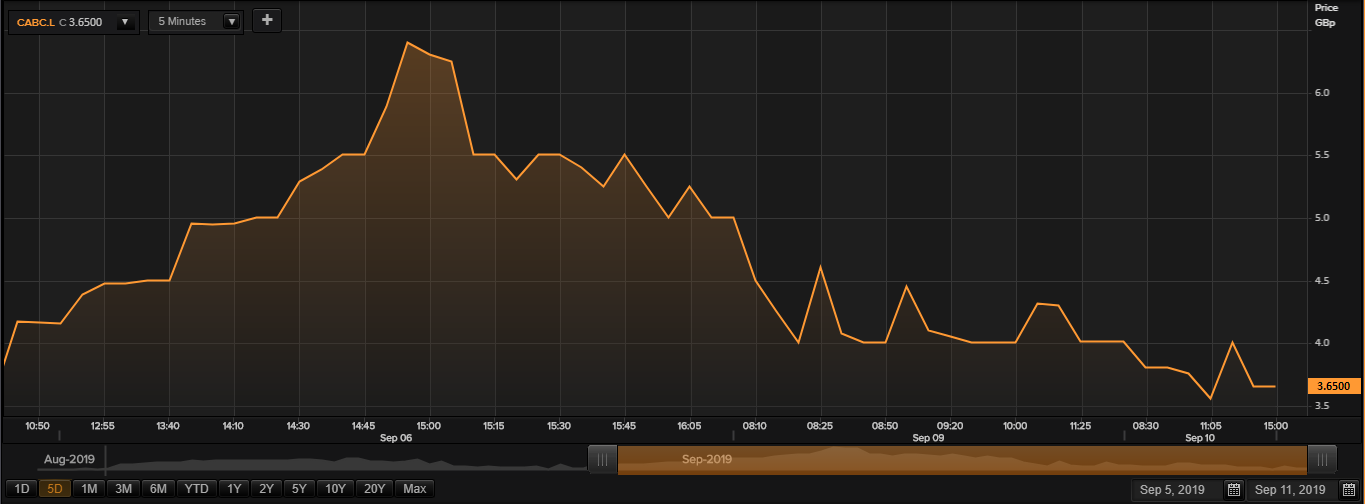
Daily Chart as on 11-September-19, before the market close (Source: Thomson Reuters)
On 11th September 2019, at the time of writing (before the market close, GMT 3:40 PM), CAB shares were trading at GBX 3.65. Stock's 52 weeks High and Low are GBX 240/GBX 3.30.
Â
ASOS Plc
ASOS PLC (ASC) is a British online fashion and cosmetic retailer with an active presence in the UK, US and Continental Europe. Apart from being a fashion company, the group calls itself a technology company and is one of the leading fashion stops for 20-somethings globally. Around 60% of the companyâs products sold are exclusively sold on its platform, and the company operates its own brand of clothes as well.
Financial highlights for H1 FY19
Despite a challenging backdrop, disruptions from large scale transformational projects and short term pricing, marketing and inventory decisions, the revenue in the period rose 14% (AER) to GBP 1,314.5m (H1 2018: GBP 1,158.1m) and retail sales grew by 13% (AER) to GBP 1,281.3m (H1 2018: GBP 1,131.3m). Gross profit rose by 12% to GBP 639.9m, and gross margin stood at 48.7% (H1 2018: 49.2%). Due to slower growth in the US and a continued increase in branded sales mix, group retail gross margin decreased by 60bps to 47.4% versus last year (H1 2018: 48.0%). Led by gross margin deterioration of 50bps and a 170bps investment in operating costs, the company generated profit before tax of GBP 4.0m, which was down by 87% compared to last year. Driven by a decline in profit after tax, diluted earnings per share fell by 88% to 3.6p.
Share price performance
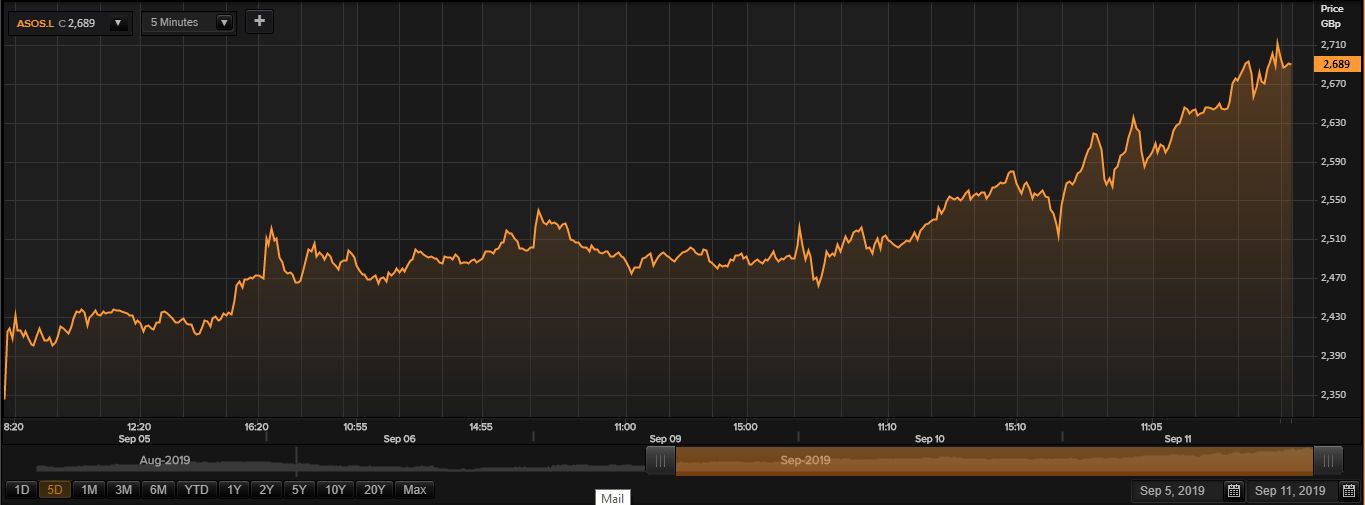
Daily Chart as on 11-September-19, before the market close (Source: Thomson Reuters)
On 11th September 2019, at the time of writing (before the market close, GMT 3:42 PM), ASC shares were trading at GBX 2,689. Stock's 52 weeks High and Low are GBX 6,153.26/GBX 2,033.00.Â
