


Highlights
- Indices are benchmark and a standard reference point for the entire stock market
- Comparison with an index gives an easy assessment of a stock’s performance
- The S&P/ASX200 index has provided the highest total return in 2012 (49.59%), followed by 2019 (43.47%)
A stock exchange is a platform where all the tradeable securities like shares, bonds, derivatives, commodities are listed. A stock market index is an indicator of its representative stock exchange. Several companies are listed on exchanges, but indices gauge only a few top-performing companies. Indices are a benchmark and a standard reference point for the entire stock market.
In short, indices remove the clutter and keep only bigger and better companies that lead the country's economy. The two major types of market indices are as follows:
- Sectoral indices - Indices which include companies falling under one sector.
- Market cap-based indices - These indices select companies based on market capitalisation
Major two factors based on which indices pick stocks
Companies with the largest market cap are picked and grouped in an index. Those with the largest market cap have a higher weightage on the index value.
- Some indices use share price to give weightage to stocks.
Why are stock indices required?
The stock market index depicts the overall scenario of the market. It facilitates the investors in identifying the general pattern of the market and acts as a reference to decide which stocks to choose for investing.
Following are some of the salient features of a stock market index:
There are thousands of stocks listed on an exchange, making it difficult to choose one for investment. It becomes tough to differentiate between stocks without a benchmark. In this circumstance, a market index acts as a handy tool, providing a reference for stock comparison.
Comparison with an index gives an easy assessment of a stock’s performance. A stock is said to have outperformed the index if it performs better than the benchmark. It is deemed to have underperformed the index if it yields lower returns than the index.
The stock index also helps in passive investment. Investing in a portfolio of assets that replicates the equities of an index is known as a passive investment. Index portfolios are used by investors who wish to save money on research and investment selection. Consequently, the returns of the portfolio will resemble that of the index.
Do read: PCK, LBT, OPL – Three AI stocks from ASX healthcare
The S&P/ASX 200 Health Care

Image source: © Olegdudko | Megapixl.com
The S&P/ASX 200 Health Care provides investors with a sector benchmark that reflects the companies included in the S&P/ASX 200 that are classified as members of the GICS® health care sector and sub-industries. The index was launched on July 02, 2002. The index uses the float-adjusted market cap weighting method.
There are a total of 14 constituents in the index. Australia holds 92.2% weightage in the index in terms of geographical breakdown, followed by the United States (6.3%) and New Zealand (1.5%).
Index performance
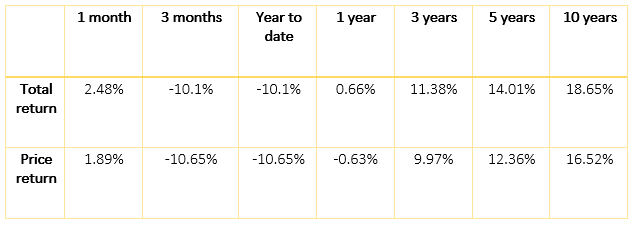
In terms of calendar year performance, the index has provided the highest total return in 2012 (49.59%), followed by 2019 (43.47%). The index offered its lowest return in the year 2016 (1.9%).
The index's price-to-earnings ratio as per February 28, 2022, stands at 28.92.
Also read: How have REG, CSL share prices fared after budget’s healthcare boost?
