


Summary
- Gold spot slips below the support level of USD 1,700 per ounce, pointing towards a slight dominancy of bears in the ongoing tug-of-war between bulls and bears.
- The recent breakout of gold below its short-term support zone coupled with market sentiments concerning the global equity front and FOMO buying is exerting pressure on ASX-listed gold stocks.
- Many ASX-listed gold stocks such as Newcrest Mining, Northern Star, Evolution Mining, have recently corrected from their top and are now trading around their crucial support zone and levels.
- In the recent past, many institutional investors have offloaded their stake in some gold mining companies across the continent, which is leading to the speculation that the shiny rally in ASX-listed gold stocks might be coming to an end.
Gold spot has finally given a breakdown below the consolidation range with spot prices slipping below USD 1,700 per ounce to trade at a low of USD 1,689.54 (as on 3 June 2020) with a close below the support level of USD 1,700 at USD 1,698.64 (as on 3 June 2020) after an array of positive data from the United States further boosted market sentiments and FOMC buying in the equity market on the global front.
Also Read: Gush for Gold; How You Should Plan to Play The Consolidation?
On 3 June 2020, the U.S ADP Non-Farm Employment data was published, the figures marked a net loss of 2.7 million in the private payroll of May 2020, and remained substantially higher both against the market consensus of -9.0 million and its record low of 19.55 million in April 2020.
Furthermore, non-manufacturing activities across the United States also picked some pace, inferred from the recent data released by the Institute of Supply Management. The ISM Non-Manufacturing PMI stood at 45.4 for May 2020, up against the market anticipation of 44.2 and its decade low of 41.8, which in turn, further exerted pressure on the gold spot.
However, the PMI data still remained significantly below its threshold value of 50.0, and many other data are still pointing towards a slow growth across the United States, preventing gold from confirming the breakout, and the gold spot has still not breached the low established on 3 June 2020 (USD 1,689.54).
The decline in the gold spot saw its impact on ASX-listed gold stocks with many of the prominent miners such as Newcrest Mining Limited (ASX:NCM), Northern Star Resources Limited (ASX:NST), Evolution Mining Limited (ASX:EVN) witnessing a brief fall during the trading session on 4 June 2020.
Many investment houses in the recent past have started liquidating their position in ASX-listed gold stocks, for example, until now, we have witnessed a substantial sell-off from institutional investors in prominent stocks like NST, and junior miners like Perseus Mining Limited (ASX:PRU).
To Know More, Do Read: Three Miners Hovering Close to 52-Week Highs- PRU, SVM, and NST
So, does it mean that the price rally of ASX-listed gold stocks is coming to an end?
Going by the current plunge from the top price levels in ASX-listed gold stocks and the recent offloading in few stocks by the institutional investors in ASX-listed gold stocks, it may seem like that, but the rally in ASX-listed gold stocks, which have been taking an impetus from the rising gold price and witnessing sentiment splash, would now depend upon the market behaviour around gold, and the hedge book of these miners would surely be a factor which needs to be checked thoroughly before reaching to any conclusion.
Market Behaviour Around Gold
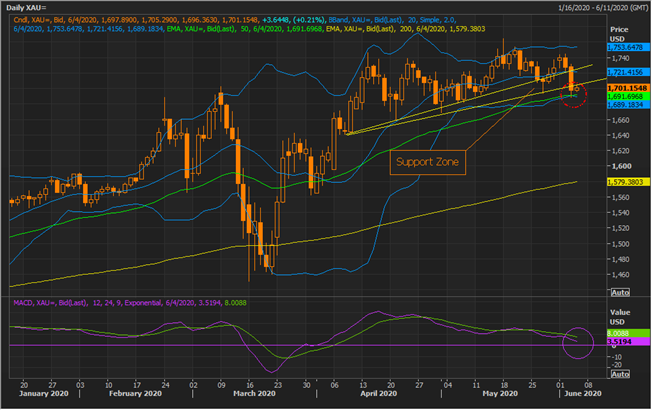
Gold Spot (USD) Daily Chart (Source: EODHD/Others Eikon Thomson Reuters)
On the daily chart, it could be seen that the gold spot has given a breakout below the support zone (made of two trendlines, and the second line is adjusted for an intraday breakout) and is currently at the -1 Standard Deviation (SD) of the 20-day simple Bollinger band.
Furthermore, while the gold spot has given a breakout below the short-term support zone, it is yet to give confirmation. Considering the present volatility scenario is gold a break below the low of USD 1,689.54 followed by a volatility break and two consecutive close below the same might bring conviction to the breakout, which though reduces the reward profile, but could prevent one from acting on a false breakout.
Also, it should be noticed that the 50-day exponential moving average is overlapping with the -1 SD of the Bollinger band, which makes the level immediate and decisive support for the gold spot. A break and sustain below the same might seed bearish sentiment, while failure to do so would keep the yellow-shine bright.
On the resistance part, the +1 SD of the Bollinger band could act as the resistance for the near-term followed by the previous high inked by the gold spot.
While the gold spot is in the tug-of-war between bulls and bears, any indication which is pointing the outcome in bears favour (such as a recent breakout below the support zone) is exerting pressure on ASX-listed gold stocks, who are also standing at the brim of a top.
ASX-listed Gold Stocks At the Brim of a Top
- Newcrest Mining Limited (ASX:NCM)
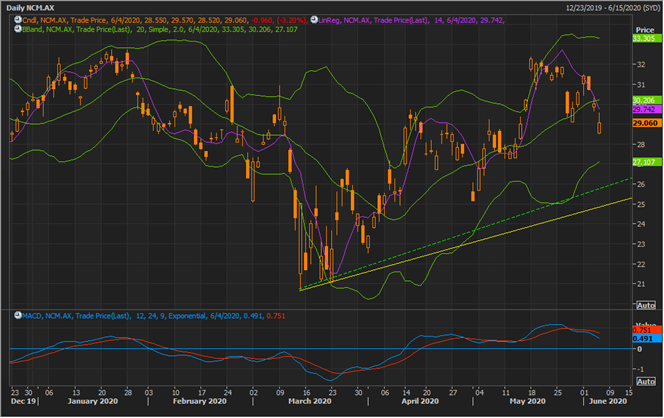
NCM Daily Chart (Source: EODHD/Others Eikon Thomson Reuters)
On the daily chart, it could be seen that the stock has slipped below its regression line (depicting time price relationship) and the mean value of the 20-day simple Bollinger band. Furthermore, the 12,24,9 MACD indicator is also giving a negative signal. However, the stock is still above its support zone (two trendlines- green and yellow), and the further movement would depend upon the market assessment concerning fundamentals and hedge position.
- Northern Star Resources Limited (ASX:NCM)
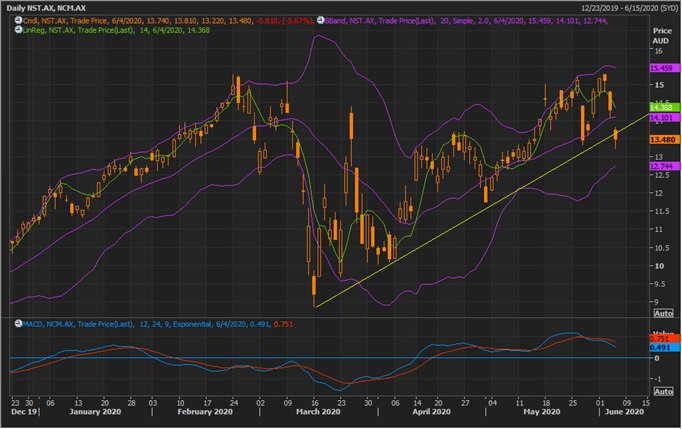
NST Daily Chart (Source: EODHD/Others Eikon Thomson Reuters)
On the daily chart, it could be seen that the stock has slipped below its short-term trendline and the mean value of the 20-day simple Bollinger band with a close below the same, but the breakout is yet pending confirmation. The stock is currently trading below the 14-day regression line as well.
The 12,24,9 MACD indicator is giving a negative signal, and the immediate support for the stock is at the -1 SD of the Bollinger band.
- Evolution Mining Limited (ASX:EVN)
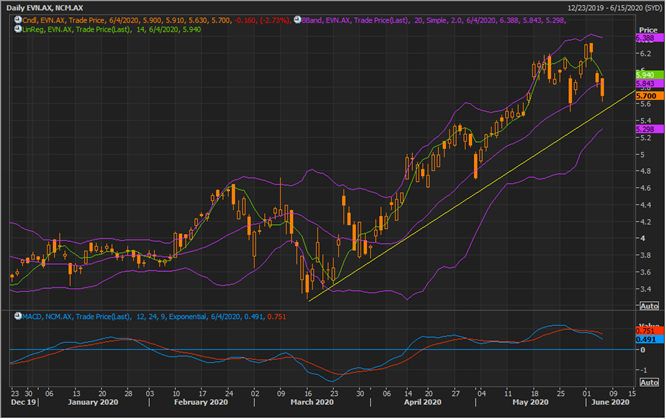
NST Daily Chart (Source: EODHD/Others Eikon Thomson Reuters)
On the daily chart, it could be seen that at present the stock is trading below 14-day regression line and the mean value of the 20-day simple Bollinger band with a negative signal from the 12,24,9 MACD indicator. However, it is still trading above the short-term trendline, which should act as immediate support for the stock, followed by the -1 SD of the Bollinger band.
Key Takeaways
To summarise, the gold spot market has given a breakout below the consolidation range after some positive economic data emerged from the United States, which further pointed towards a slight dominance of bears in the ongoing tug-of-war between bears and bulls, leading to a plunge in ASX-listed gold stocks during the trading session on 4 June 2020.
In the recent past, we have witnessed few institutional investors offloading their stake in ASX-listed gold miners around their 52-week highs.
However, like gold breakout is pending confirmation, many of the ASX-listed gold stocks are also testing their short-term support, and a clear outcome of the ongoing battle between bulls and bears in the gold market along with the market assessment related to fundamentals and hedge of their gold miners would decide their future direction.
