

The inversion of the US yield curve triggered fears of the recession on Thursday, wiping off $60 billion from the Australian equity market. The benchmark S&P/ASX 200 Index closed 2.9 per cent lower on 15th August 2019 at 6408.1 points, recording its worst session since February 2018. The broader All Ordinaries index was also 2.8 per cent down to 6,491 points.
On August 14, 2019, Dow Jones slid down by 800.49 points, settling at 25,479.42. Also, S&P 500 Index fell by 85.72 points at 2840.60.
The US bond market?s performance indicated that the world?s largest economy is possibly heading towards a recession with an inverted yield curve, which occurs when the interest rates paid by long-term bonds are lower than that of short-term bonds. This has frightened the investors who typically invest in longer-term bonds to receive a higher yield. The yield on the US 10-year Treasury fell below 1.5 per cent while the 30-year Treasury bond yield dropped below 2 per cent on Wednesday. The historic drop in long-term U.S. bond yields flashed a warning sign for the US economy, driving down the global stocks.
Amid this shaky global scenario, the benchmark S&P/ASX 200 Index delivered a negative return of 2.67 per cent in the last five days, driven by the global concerns and financial results reported by multiple ASX-listed companies during the ongoing reporting season.

S&P/ASX Performance (10th August 2019 ? 15th August 2019), Source: ASX
Take a look at the performance of the sectoral indices in the past five days (10th August 2019 - 15th August 2019) on the ASX:
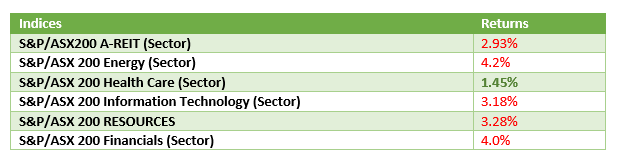
Except for S&P/ASX 200 Health Care (Sector), all the other major sector indices have delivered negative returns in the last five days, with the largest drop seen in the Financial sector index. The performance of the indices was influenced by the financial results announced by multiple ASX-listed companies in this week.
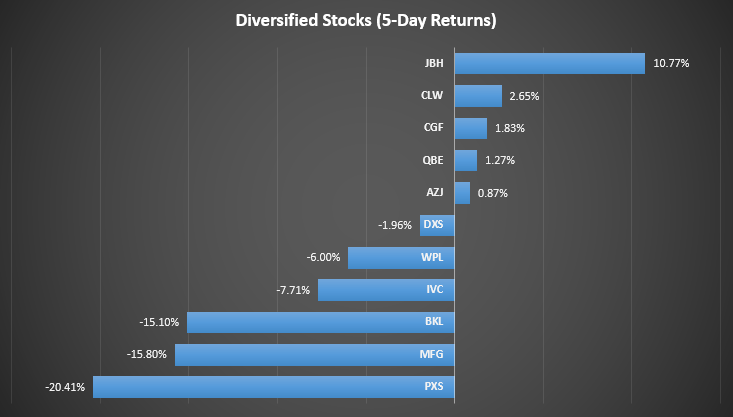
Take a look at five-day returns of some of the companies that released their financial results recently:
Let us now take a quick look at the key financials of the companies that have recently published their financial results:
Stocks with Positive 5-Day Returns
JB Hi-Fi Limited (ASX: JBH) reported robust results for the financial year 2019, with a rise of 7 per cent in its net profit after tax to $249.8 million and a growth of 4.1 per cent in its total sales to $4.73 billion. The gross profit of the company improved by 3.9 per cent to $1.05 billion, generating a gross margin of 22.1% per cent.
Charter Hall Long Wale REIT (ASX: CLW) announced its FY19 results on 12th August 2019. The company reported a rise of 2 per cent in its operating earnings to $70.8 million on pcp. The statutory profit of the company was reported to be $69.6 million while its NTA was 1 per cent up on pcp at $4.09.
Challenger Limited (ASX: CGF) has also published its 2019 financial year results recently. The company saw a 1 per cent rise in assets under management to $81.8 billion. The Normalised net profit before tax was $1 million up to $548 million during the period while Normalised net profit after tax was $10 million down to $396 million.
General insurance company, QBE Insurance Group Limited (ASX: QBE) released its 1H19 financial results on 15th August 2019. The company?s statutory NPAT was 29 per cent up on pcp at $463 million and its cash profit after tax was 35 per cent up on pcp at $520 million.
For the financial year ending 30th June 2019, Aurizon Holdings Limited (ASX: AZJ) reported Underlying EBIT of $829 million, which was 12 per cent down on pcp. The company?s Non-Network businesses contributed $450 million to its EBIT. The Underlying NPAT of the company was 13 per cent down on pcp at $473 million.
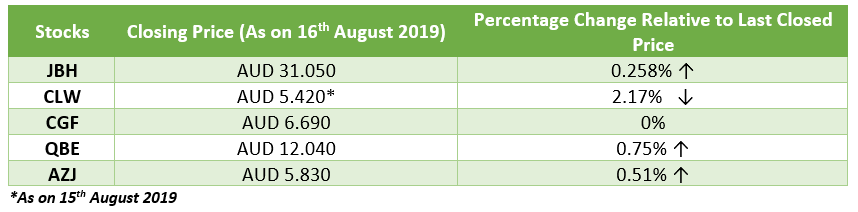
The table below shows the performance of the stocks with positive 5-day returns:
Stocks with Negative 5-Day Returns
In FY19, Dexus (ASX: DXS) logged a fall of 25.9 per cent in its net profit after tax to $1.28 billion while a rise of 4.3 per cent in its Funds From Operations (FFO) to $28.2 million. The company achieved a Return on capital employed of 10.1 per cent in FY19.
Pioneer of the Australian LNG industry, Woodside Petroleum Limited (ASX: WPL) recorded a net profit after tax of $419 million for the first half of 2019. The company informed that its operating revenue was $2,260 million and its production was 39.0 MMboe in the first half.
Blackmores Limited (ASX: BKL) reported NPAT of $53 million and revenue of $610 million for FY19. The revenue of the company improved marginally by 1 per cent on pcp, and its NPAT was 24 per cent down on the prior year. The Underlying full year NPAT was also 19 per cent down to $55 million.
Healthcare Player, Pharmaxis Limited (ASX: PXS) saw a fall in its revenue from continuing operations from $6.09 million in 2018 to $5.67 million in 2019. The company also reported a loss of $20.05 million in FY19 against the profit of $6.42 million recorded in FY18.
Below are the stocks which recorded fall in stock prices despite posting decent financial numbers:
Specialist funds management business, Magellan Financial Group Limited (ASX: MFG) recorded a rise of 28 per cent in its Average funds under management to $75.8 billion, and an increase of 35 per cent in its Adjusted net profit after tax to $364.2 million during the financial year 2019.
InvoCare Limited (ASX: IVC) saw a positive increase in sales and margins on PCP in its 2019 half-year. The company reported an Operating EBITDA growth of 16.9 per cent during the period. Its Underlying earnings after tax also improved 8.6 per cent to $21.2 million in the half year.
The table below shows the performance of the stocks with negative 5-day returns:
| Stocks | Closing Price (As on 16th August 2019) | Percentage Change Relative to Last Closed Price |
| DXS | AUD 12.990 | 0.307% ? |
| WPL | AUD 31.210 | 0.096% ? |
| IVC | AUD 14.370 | 2.64% ? |
| BKL | AUD 66.91 | 5.62% ? |
| MFG | AUD 51.64 | 0.95% ? |
| PXS | AUD 0.195 | 4.88% ? |
?
On 16th August 2019, the S&P/ASX 200 Index closed the trading session at 6405.5 points, down by 2.6 points relative to the last closed price. Investors may keep a close eye on the remaining earnings disclosure while the developments in the US economy continue to drive investor sentiments.
Disclaimer
This website is a service of Kalkine Media Pty. Ltd. A.C.N. 629 651 672. The website has been prepared for informational purposes only and is not intended to be used as a complete source of information on any particular company. Kalkine Media does not in any way endorse or recommend individuals, products or services that may be discussed on this site. Our publications are NOT a solicitation or recommendation to buy, sell or hold. We are neither licensed nor qualified to provide investment advice.

