
Definition
Related Definitions
Z-Test
What Is Z Test?
Z test is a test employed for the purpose of hypothesis testing when the sample size is large. Larger sample sizes are used because as per the Central Limit Theorem, as the samples increase, they tend to get normally distributed. The value derived using the Z test is called the Z score. Z score tells us how many standard deviations the value is away from the population mean. Z test may be one-tailed test or two-tailed test.
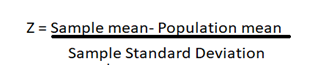
The Z Score is derived based on the following formula -
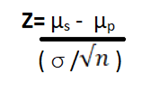
Where,
µs = sample mean
µp = population mean
σ = population standard deviation
n = sample size
Summary
- Z test is used to study the significance of statistical parameters
- We can perform one-tailed test or two-tailed test to assess the significance
- Data must be normally distributed for the purpose of Z test
Frequently Asked Questions (FAQs)
What Are the Requisites to Perform The Z Test?
- Sample size > 30
- No dependence or correlation between two data points
- Normally distributed data
- Sample well representative of the population
What Are the Uses of Z Test?
The Z test is used-
- To compare sample mean and population mean
- To determine the significance of various statistical measures, mainly the mean
- To compare population parameters of two samples
What Is the Practical Application of Z Test?
Let us take a simple hypothetical example. The research and development team of a company is studying the effect of a new engine design on the travel time from point A to B. Without the new design, the average or mean travel time is 1.2 minutes. The sample of 100 new engine vehicles tested showed an average travel time of 1.05 minutes with sample standard deviation equal to 0.5 minutes. Does the new design have an impact on travel time?
So based on the process of hypothesis testing, we set
Ho: New design has no effect (this implies that with the new engine design too, travel time is 1.2 minutes)
HA: New design has effect ( i.e. travel time with new engine ≠ 1.2 which means it is either > 1.2 or < 1.2 minutes)
In this problem, Sample mean= 1.2, Population mean= 1.05, and Sample standard deviation= 0.5. Hence,
Z= (1.2-1.05)/ (0.5/ = 3
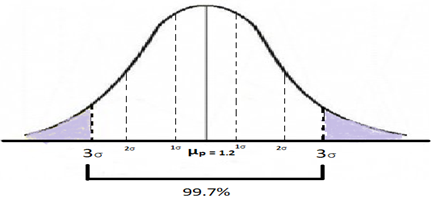
This means that the 1.05-minute average that we derived from the sample is 3σ away from the population mean of 1.2 minutes, which means 99.7% of the areas under the normal distribution bell curve as shown in the graph below. This also means that the shaded region is 0.3% of the total area under the curve.
We can thus arrive at the conclusion that probability of Ho being true is only 0.3% therefore we accept HA in this case.
Copyright © 2021 Kalkine Media Pty Ltd
Let us consider another usage of Z test. Suppose an average household in country A uses 2 litres of cooking oil in a month with a standard deviation of 0.7 litres. Due to the sudden lockdown and severe containment of the coronavirus, people are locked up in their homes without sufficient essentials. The residents’ welfare association of a locality decides to provide the essentials on a need basis. However, without actually asking the residents, the needs were judged based on the region’s consumption patterns published in various sources and items were stocked up. Given that there are 50 households who would need this service of the association, what is the probability that the association will run out of oil if it has stocked up 110 litres for distribution?
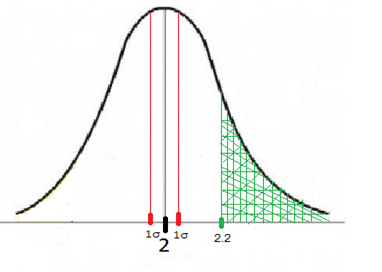
Here we see that the association has 110 litres of oil for 50 families, which means that on an average, a family can be given up to 110/50= 2.2 litres of oil. So, the probability of running out of oil is equal to the probability of an average household needing more than 2.2 litres of oil (the green segment on the graph).
Copyright © 2021 Kalkine Media Pty Ltd
A sampling distribution would have to be done for the sample mean when sample size(n) is 50. If several times we took samples of 50 in the country and plotted their oil consumption pattern, we could arrive at the fact that the mean of those distributions is equal to that of the population mean i.e. 2 litres in this case.
Copyright © 2021 Kalkine Media Pty Ltd
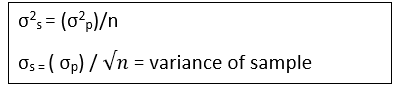
This will be a normal distribution and the variance of the sample will be equal to (the variance of the population/n) i.e. 0.099 in this case
Thus, the standard deviation for the sampling distribution will be 0.099 in this case.
Let us now see how many standard deviations away from the mean is this situation. For this we use the formula:
Copyright © 2021 Kalkine Media Pty Ltd
In this example, Sample mean= 2.2, Population mean= 2, Sample standard deviation= 0.099, Thus
Z = (2.2 – 2)/0.099 = 2.0203
Corresponding value in the Z table is 0.9783
This implies p= 0.9783 which indicates the probability of 2.02 σ below the mean (indicated by the area to the left of the green segment on the graph above )
Thus probability of 2.02 σ above mean is ( 1- 0.9783 ) = 0.0217
Which helps us conclude that the probability of the association running out of oil is 2.17%.
What is the difference between one-tailed test and two-tailed test?
When the null hypothesis gets rejected due to the test statistic falling in one tail of the distribution, it is called one-tailed test. On the other hand, when the value of the test statistic falls in either one of the two tails of the sampling distribution, it is called a two-tailed test. Suppose we want to study a stock on the ASX and it is said to be a performing well if it has a CAGR of at least 5%. This will be a one-tailed test, where:
Ho: CAGR is less than 5%
HA: CAGR is greater than or equal to 5%
Another case is where an analyst gives a projection of $6.5 as a company’s EPS. We need to check if the projection is correct. This will be a two-tailed test where:
Ho: EPS ≠ $6.5 (i.e. EPS < $6.5 or EPS > $6.5)
HA: EPS = $6.5