
Definition
Related Definitions
Z-Score
What is Z-Score?
Z-Score, also known as the standard score, gives us an idea about the position of the data point from its mean position. It is a measure of how many standard deviations is the raw data above or below the population mean.
A z-score can be placed on a standard normal distribution curve ranging from -3 standard deviation to +3 standard deviation.
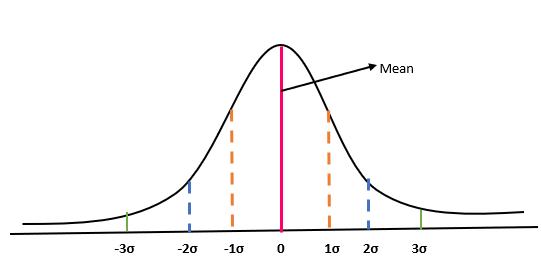
The probability of any score falling in the bell curve is 100%, with equal distribution on either side of the mean. Thus, the likelihood of an observation falling towards the right or left of the mean is 50%.
- The probability of any observation falling in between 0 to 1σ and 0 to -1σ is 34% and 34% respectively. Hence the probability of observation falling in between -1σ to 1σ is 68%.
- The probability of any observation falling in between -2σ to 2σ is 97.72%
- The probability of any observation falling within 3σ is 2.28%.
Advantage of using Z-Score
Z-score helps to compare the results from the normal population. For example, if a researcher conducts a survey to find its target audience who are obese. The survey is conducted for the upcoming product for weight loss. He gets multiple data. For the company, people with weight over 155 pounds would be the target audience. Now, after the completion of the survey, there would be n number of data. Now, the researcher wants to know what would be the probability that any person from the target audience would choose the product. Hence, to find probability, first, the researcher would follow the below steps:
- Find the mean weight of the total population (µ).
- Find the standard deviation (σ).
- Subtract each weight in the dataset from the mean and then divide it by the standard deviation.
In this case, let us assume that µ is 155 pounds, σ is 70. Since the product is for obese people, and the researcher wants to understand the probability of people with a weight between 155 pounds and 250 pounds would choose this product. Based on this problem equation, it is clear that our target population is towards the right side of the bell curve or standard deviation curve (shaded region).
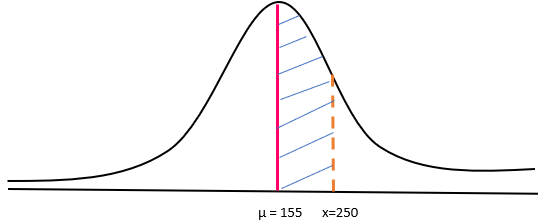
So, the z-score, in this case, would be 1.357. In the next step, we would look into the z-score table for value approximately 0.4131 or 41.31%.
Calculation of Z-Score
The formula to calculate z-score is
Z= (X- µ)/ σ
X: Observed value or score
µ: Mean
σ: Standard Deviation
Z-Score Formula in case of multiple samples
In the case of multiple samples, if we want to standard deviation of those sample means (standard error), we use the below standard means.
z = (x – μ) / (σ / √n)
Using this formula, we would be able to find the number of standard errors that are between the sample mean and the population.
In the above formula:
Z is the z-score
X is the observed value
σ is the standard deviation and
n is the random sample
How to interpret a Z-Score?
The value of z-score tells you the distance of the observed value from the mean position. If the z-score is equal to 0, then the observed value is on the mean. In case the z-score is positive, it means your observed value is above the mean average. On the other hand, if the value of z-score is negative, it means that the observed value is below the mean average.
Real-life application of Z-Score
Let us understand this concept with an example. Suppose a student scores 85 in the first exam and 75 in the second exam. We want to understand in which exam did the student perform well.
Now, in exam 1, the mean score is 95, and the standard deviation is 10.
In exam 2, the mean score is 65, and the standard deviation is 5.
Solution:
In Exam 1:
z-score = (85-95)/10
=-1
In Exam 2:
Z-Score= (75-65)/5
= 2
Based on the z-scores, we can say that the students have done well in the second exam as compared to the first case. In the case where we saw z-score is -1, it means that there are 34.13% of students who scored below the average marks. On the other hand, a z-score of 2 represents that 47.42% of the students who appeared in the exam scored higher than the average marks of the class.
Please note: The % value of z in the above cases is derived using a z-score table.