
Definition
Related Definitions
Yield Curve
What is the yield curve?
Yield curve is a graphical representation of interest rates or yields on bonds offered on different maturity dates. Yield curves are important tools used to determine the yield on bonds that have the same credit quality but different maturities. A yield curve has interest rates on the x-axis and the maturities on the y-axis.
A yield curve can take different shapes depending on the economic cycle. It helps analyse the difference between the short-term and long term-bonds by displaying the yield offered on both. They are usually upward sloping because an investor who is willing to invest in a long-term bond must be compensated with higher yield.
ALSO READ: Understanding Yield Curve Relationship
What are the different types of yield curves?
Normal Yield Curve: This is the shape that a yield curve usually takes under regular conditions. In a normal yield curve, short-term bonds offer lower yields while long-term bonds offer higher yields. The short-term bonds are associated with lesser risk, hence the return on these bonds is usually less.
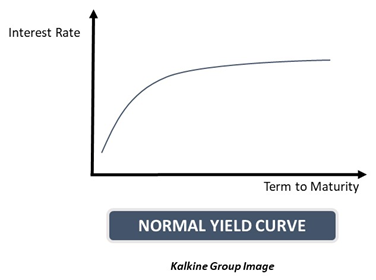
However, when there is a higher risk involved, then investors would want higher returns. Similarly, long term bonds reflect the fact that investors have put their funds on hold. These funds could have been put elsewhere over a long duration and thus, have an opportunity cost attached to them. Therefore, longer-term bonds have higher yields.
Also, a longer period means that the bond is susceptible to a greater number of uncertainties.
A normal yield curve exists when the economy is expected to grow at a normal pace, and in such cases, investors predict a steady economic growth.
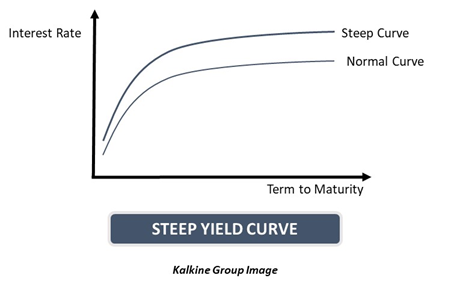
- Steep Curve: A steep yield curve represents that yield on long-term bonds is increasing at a faster rate than that on the short-term bonds. This type of curve is based on the similar market set-up as the normal yield curves.
In this type of curve, there is a large difference between the yield of short-term bonds and long-term bonds. This typically happens during the start of an economic expansion. During this time, short-term interest rates are low due to monetary policy actions by the central bank. During a depression, central banks usually lower interest rates, to encourage spending and investment in the economy. Thus, when an economy moves onto economic expansion, the short-term interest rates are likely to stay low.
High demand for capital is another feature of this phase of the economic cycle, which may lead to inflation. Investors locked into long-term bonds might fear that the returns they would receive on their investments would decline due to inflation. Thus, they start to demand higher yield on the long-term investments.
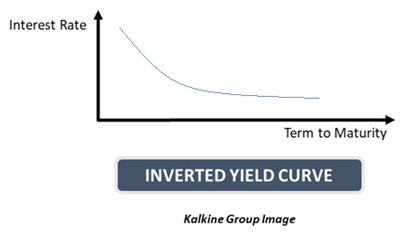
- Inverted Cure: This curve represents a higher yield on short-term bonds and a lesser yield on long-term bonds. This type of yield curve occurs due to the perception of the investors, i.e., when they expect that yield would decline in the longer term.
Long-term investments are expected to decline when there is an expectation of fall in inflation. An inverted shape of the yield curve represents an economic downturn or a stagnation on the economic growth.
These types of yield curves are rare and are counter-intuitive. An expectation of a recession in the future might lead investors to lock in the current interest rates as they are expected to fall even further. All along the curve, the interest rates remain low.
RELATED READ: Understanding The Concept Of Inverted Yield Curve
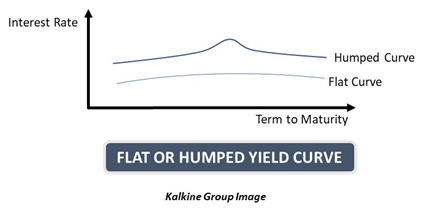
- Flat Yield Curve or Humped Yield Curve: When the normal yield curve transitions into an inverted yield curve, it must pass through a phase where the curve is flat. This is the time when short term rates are almost equal to the longer-term rates. Thus, the shape of the curve appears to be flat as both types of maturities fetch the same amount of interest.
These curves may sometimes be humped in the middle, as the bonds maturing in the medium term might offer slightly higher interests. Not all flat curves may transition into inverted curves. However, if the yield curve becomes flat, then it is important to be alerted about the possibility of a recession and the curve getting inverted.
Why are yield curves important?
Yield curves are visual representations of interest rates differing with maturity, and thus, they can be used to assess the economic stability during a given time. The shape of the yield curve can be used to alarm investors as well as policy makers about what shape the economic growth might take.
A yield curve also measures the risk that investors associate with the markets. The yield curves on government bonds are used as a benchmark to measure the economic stability. With proper knowledge and adequate experience, investors can use yield curves to determine where to invest.
However, it is important to note that yield curves are only a tool to determine the future shape of the economy and are not like a window into the future. It requires experience and expertise to make investment decisions based on yield curves. They can only be used for guidance.