
Definition
Related Definitions
Standard Deviation
What is Standard Deviation?
Standard deviation could be defined as a measure of dispersion that describes the variability around the central tendency and is often a measure of risk.
Also, in statistical terms, standard deviation could be defined as the positive square root of the variance, determined using each data point’s deviation relative to the mean.
If each observation in a data set lies very far away from the central tendency (or mean), it leads to a higher deviation within a data set.
In the field of finance, standard deviation reflects on the risk over the rate of return by shedding light on the historical volatility of the underlying security.
In statistics, though the concept around standard deviation remains same, the calculation could vary upon the type of data under consideration, leading to a division in types of standard deviation, i.e., population standard deviation and sample standard deviation.
Problem with Variance and Why do We Need Standard Deviation?
Variance is another measure of dispersion that could be defined as the arithmetic average of the squared deviations around the mean.
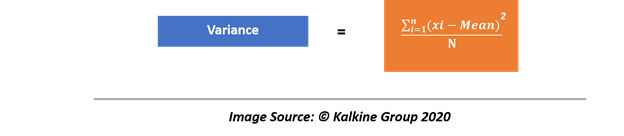
Given knowledge of the mean, we could calculate the variance of a data set by calculating the sum of squared difference of each data point from the mean and then dividing it by the total number of observation.
While variance takes care of any negative dispersion which other measures of dispersion such as Range tend to present by squaring the deviation of each observation from the mean, it leaves statistician with another problem.
- The major problem with the variance is, it does not have the same unit of measure as of the original data.
- Another considerable problem with variance is that the squared dispersion from the mean tends to skew the data.
These problems with variance as a measure to estimate the dispersion around the central tendency leads to a solution in the face of standard deviation.
Calculating Standard Deviation For a Population
One way to fix the unit problem with the variance is to take the square root of the variance to return to the original unit of the data, and that is what standard deviation does (recall from the definition that standard deviation is the square root of variance).

To estimate the standard deviation of the data, we require two data from our data set, i.e., the mean and the variance.

For example, assume a portfolio with above-mentioned annual returns. To calculate the standard deviation of the above data set, follow the steps mentioned below.
- First, calculate the mean value of the data set.
- After finding the mean of the data, subtract mean value from each observation or data point, i.e., calculate dispersion.
- Post calculating the dispersion, square each dispersion data to reach squared dispersion.
- Once we have the squared dispersion for each observation, we can add them all to calculate the sum of squared dispersion.
- To calculate the variance, just divide the sum of squared dispersion with the total number of observation.
- To calculate the standard deviation, take the square root of the variance.
Post following the above method, it could be estimated that the standard deviation for the data is 11.92%; thus, an investor having a portfolio of the above companies can expect an annual variation of 11.92% in returns.
The above calculation is for a population, to calculate the standard deviation for a sample, we need to adjust the dominator for both variance and standard deviation. Ideally, statistician uses (n-1) in the denominator, i.e., one less the total number of observation to estimate the variance and standard deviation of a sample.
Drawbacks of Standard Deviation
While standard deviation is a standard measure of risk used in the industry, there is a major problem with it. As it could be seen from the above calculation, the value of standard deviation experience a major drag from outliers.
In the above example, while the mean annual return for the portfolio is 19.21%, the annual risk or variation in returns (as measured by standard deviation) is 11.92%. The primary reason behind the large standard deviation of the above data set is the presence of an outlier in the data set, i.e., 50.6%.
Other Measures Using Standard Deviation
As both variance and standard deviation deal with the overall risk, i.e., take both upside and downside dispersion into consideration, analysts across the globe have developed some other measures to estimate the downside risk only, as a majority of investors only concerns themselves with the downside risk.
Most widely accepted statistical measures using standard deviation, which only reflect the downside risk are semivariance and semideviation.
- Semivariance and Semideviation
The calculation of semivariance is a minor change in the calculation of the variance. For calculating the semivariance, one has to take only negative dispersion into account. For example, in the above presented data, the semivariance could be calculated as below.
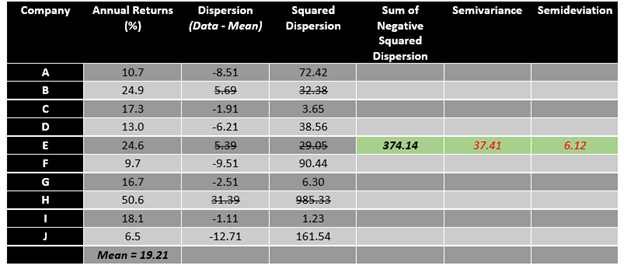
To calculate the semivariance, one should only sum the squared terms of negative dispersion and then divide it by the total number of observations. The square root of semivariance is known as semideviation, which only focuses on the downside.
So, by analysing the above data set, it could be said that the average annual return is at 19.21% with a downside dispersion risk of 6.12 per cent (as measured by semideviation).