
Definition
Related Definitions
Production Possibility Curve
What is the Production Possibility Curve or PPC?
A production possibility curve depicts the maximum output that can be produced in an economy with the given resources. The resources used to make these goods refer to the factors of production in the economy.
PPC may sometimes also be referred to as the production possibility frontier, or PPF. PPC depicts the trade-offs faced by producers in the economy. Due to the scarcity of resources, producers must allocate these resources into the production of those goods that derive maximum welfare.
For instance, consider an economy that can produce only two goods, given the resources that it is endowed with. The two goods produced are war machinery and bread. However, the producers must decide how much of each to produce. During a war, production of war equipment might increase; however, when the war ends, bread production would increase and therefore, production of war equipment must decrease because of limited availability of inputs.
How is the PPF represented graphically?
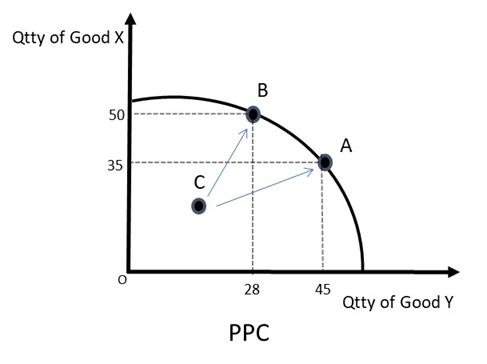
The above PPF represents the production possibilities in an economy that produces Good X and Good Y. A PPF would depict the trade-off between the production of only two goods at a time. Hence, a PPF can be graphically made for only two goods at a time.
Point A has an allocation of 35 units of Good X and 45 units of Good Y. Similarly, point B is a combination of 50 units of Good X and 28 units of Good Y. Both these points lie on the curve and neither outside of it, nor inside of it. Thus, they are efficient and achievable allocations for this economy.
Point C lies inside the PPC curve. This means that it is an inefficient allocation of resources. Point C fails to efficiently utilise the entire amount of labour, land, and capital that the economy possesses. Thus, if the resources were allocated more efficiently and used to the fullest, then the allocation would lie on the curve and not inside it.
Thus, points A and B are Pareto efficient allocations as it is not possible to increase the production of Good X without decreasing the production of Good Y. Whereas, point C is not a Pareto efficient allocation as it is possible to move to an allocation that has a higher production of both Good X and Good Y. This can be achieved by moving to point A or point B.
Any point lying outside the PPC curve is not attainable as the economy is not equipped with enough resources to produce that allocation of goods.
Why is the PPF concave to the origin?
The PPF is downward sloping because of the trade-off that exists between the production of the two goods depicted in the curve. Due to the limited availability of factor inputs, units of a good must be sacrificed to produce an additional unit of the other good.
In the example of Good X and Good Y given above, moving from point B to point A increases the quantity of Good Y produced; however, this shift simultaneously decreases the quantity of Good X produced.
However, this trade-off increases with the number of goods produced. Consider the following diagram:
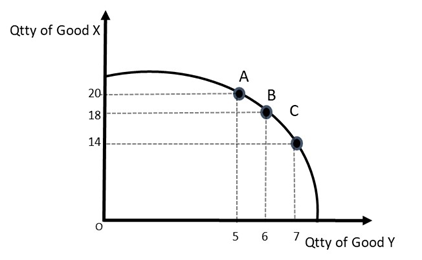
Moving from allocation A to B, the production of Good Y increases by one unit, while the production of Good X decreases by two units. Thus, two units of Good X are foregone to produce one additional unit of Good Y.
Now, moving from allocation B to C, the production of Good Y increases by one unit as before; however, the production of Good X decreases by a higher volume of four units. Therefore, four units of Good X are foregone to produce one additional unit of Good Y.
Thus, the marginal opportunity cost of production of Good Y goes on increasing as more and more units of Good Y are produced. More and more units of one good must be sacrificed to produce an additional unit of the other good.
When does a PPC curve shift?
A PPC curve may shift upwards when there is increased investment, and there is a boost to the factors of production. Alternatively, PPC may shift inwards when there is a sudden decrease in the factors of production and the production capacity falls. This may happen during a natural disaster, or a medical emergency when several lives are lost.
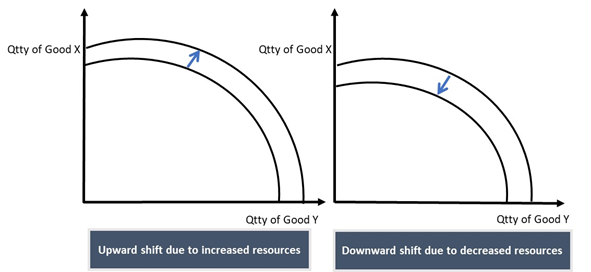
An economy may underproduce in times of a recession. Thus, in the case of an economic slowdown, an economy might function at a point inside the PPC rather than at a point that lies on the curve.
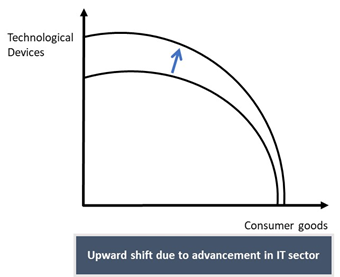
However, these shifts may also be skewed to one side depending on the good that benefits from the increase in investment or through an increase in factors of production. For instance, consider the PPC when the trade-off exists between the production of consumer goods and technological devices. When there is an advancement in the IT sector then only the technological devices would benefit from it. Thus, the PPC shift would be skewed towards the production of technological devices as shown:
What does the PPC tell about the economy?
A PPC only tells how much of one good must be sacrificed to produce one unit of the other good. However, it does not describe how much of both goods must be produced in the economy. Thus, producers and the government must decide on how much to produce.
In a free market, the law of demand and law of supply govern the quantity of goods produced. The PPF ultimately determines the amount of supply in the economy. However, it can not determine the demand level in the economy. Therefore, PPC is one of the prime tools used in macroeconomics to determine the aggregate supply level and determine whether the economy is functioning efficiently or not.