
Definition
Related Definitions
Market Cycle
What is a market cycle?
The trends or patterns that emerge during various business contexts are referred to as market cycles. The term "market cycle" refers to the economic trends in various business contexts. It is also known as a stock market cycle. One security, or a group of securities from the same asset class, outperforms others- this could be because the current market conditions are conducive to growth, depending on the business model that the securities are based on. Most of the time, the stock market's overall strength or weakness is strongly tied to economic and political dynamics. When earnings are good, and interest rates are low, stock market indexes, for example, tend to climb. Conversely, stock prices fall, or the market becomes flat or stagnate when company earnings fall short of forecasts, or investor confidence is undermined. Trends or patterns that arise during various business contexts are referred to as cycles.
Summary
- The trends or patterns that emerge during various business contexts are referred to as market cycles.
- The phases of the market cycle are – the accumulation phase, the mark up phase, the distribution phase and the mark down phase.
Frequently Asked Questions (FAQs)
What are the phases of the market cycle?
A market cycle is divided into four phases-
The economy and market bottom out in the first stage, which is called accumulation. Investors who are not averse to risks are looking for bargains and low values.
The second phase is the markup phase, which occurs when investors' confidence has returned, and they are willing to put their money to work. Some early investors may decide to sell out to pursue fresh opportunities.
As prices get more turbulent and continue to edge lower, more investors seek to reduce back on their positions, and this phase sees distribution.
Finally, in phase four, the markdown stage begins, when the last investors leave, and prices plummet. Some of the phase one early adopters begin reinvesting at this stage.
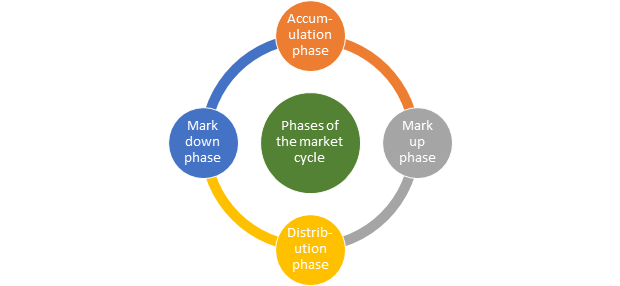
Image source © 2021 Kalkine Media
Accumulation Phase of the market cycle
Accumulation occurs when investors resume buying after believing that the worst is past, that markets have "bottomed out," and that the economy's prospects are improving. In essence, prices are low, yet the value is enormous. The accumulating begins as soon as the market reaches its lowest point. Value investors, money managers, and experienced traders begin buying shares with a belief the worst is gone, and values become critically important. The market attitude shifts from negative to neutral throughout this time frame. The market, though, remains negative.
Consolidation occurs during the accumulation phase. There is no discernible pattern, and the stock tends to trade in a range. It is a period during which traders and institutions are slowly building up stock positions, but the market has yet to break out. It is also known as a "basing" time. It begins after the selling has begun to ease up and short sellers have begun to take their profits at the end of a decline.
The moving averages will produce contradicting signals during this time, indicating that the market is not trending. If it starts to break out, the longer the accumulation period, the more explosive the run-up will be.
Mark up phase of the market cycle
During the markup stage, investors begin to pour in considerable amounts of money, resulting in a significant increase in market volume. This is the point at which the price starts to break out of the accumulation phase and begins to establish higher highs. Big Players would have fully acquired their positions, resulting in a considerable amount of buying power in the Asset/Stock. While stock prices begin to rise above historical norms, unemployment and layoffs continue to rise.
At the markup stage, market mood shifts from neutral to positive or bullish, and in some situations, there is a euphoria surrounding it. Due to the participation of fence-sitters and risk-averse investors, a selling climax is witnessed- a final parabolic price surge. Price activity will move into a long-term uptrend during the Markup phase. For well informed investors, this becomes the most profitable stage to make investments in stocks. There are a few possible patterns that can be observed during the mark up phase. First, upside breakout is a pattern that occurs during the markup phase. Overall demand in the Asset/Stock increases once big players or smart money traders have fully acquired their positions during the accumulation period. Prices rise and go beyond the resistance range of the accumulation phase. This breakout signals significant buying pressure and attracts long-term investors. As a result, prices are expected to rise.
Another pattern that could be observed during the mark up phase is called the jump a creek pattern. It is a significant retest that follows the upside breakout. This is the point at which inexperienced traders attempt to sell the asset/stock without being aware of the long term markup phase.
Re-accumulation is another possible pattern. It is a sign that big money or smart money traders are buying the asset/stocks during an uptrend. In the re – accumulation pattern, the support zone will keep firm. Prices will continue to rise following the re-accumulation trend.
Image source © Maribaben | Megapixl.com
The distribution phase of market cycle
The third phase of the market cycle sees sellers take control. This stage of the cycle is marked by a period during which the initial phase's bullish emotion gives way to a mixed sentiment. As a result, prices can often be trapped in a trading range for weeks or even months at a time.
When the markup phase concludes, and the price enters another range period, the distribution phase begins. The shares are sold over time, which is the polar opposite of accumulation. This time the sellers intend to keep the prices higher until the shares are sold.
Markdown phase of the market cycle
Price activity moves into a long-term downtrend during the Markdown phase. It can mean high losses for existing shareholders or asset holders. Security values plummet far below what investors paid for them when they first bought them. Investors begin to buy depreciated stocks in this phase and mark the beginning of another phase of accumulation.
The price begins to make lower lows and breaks down from the distribution phase at this point. Big players sell significantly in this stage. Traders that are aware of this will either close their existing long positions or open new bearish positions.
During the markdown phase, markets can be pretty volatile. During this stage, short selling might yield significant profits.
Possible patterns that can be seen in the markdown phase are downside breakout, break the Ice and redistribution. During the distribution phase, when big players or smart money traders completely liquidate their positions, overall demand for the asset/stock diminishes. As a result, price action will fall and break the distribution range's support. This breakout demonstrates heavy selling pressure, attracting even more short sellers. As a result, prices will start to fall.
Break the Ice is a significant retest that follows the downside breakout. This is when uninformed traders try to buy the asset/stock without realising that it is in the midst of a long-term markdown. As a result, prices may temporarily climb before falling back to much lower levels. Traders that aren't well-versed in the market could get trapped in this.
The redistribution pattern is a sideways range similar to the distribution phase but occurs within the long-term downtrend/markdown. It is a sign that big players or smart money traders are shorting assets or equities in a downtrend. In the Redistribution pattern, the resistance zone will hold strong. As a result, prices will continue to fall even further after the Redistribution pattern.