
Definition
Related Definitions
Lorenz Curve
What is the Lorenz curve?
Lorenz curve is a graphical representation of the inequality in wealth that exists in the society. It is used in economics to display the spread of income. Lorenz curve was given by Max Lorenz in 1905.
Lorenz curve depicts the cumulative share of income received by the entire population up to a certain quintile. It is represented alongside a 45-degree line that is upward sloping. In the curve, the cumulative share of income lies on the y-axis, whereas the income quintiles lie on the x-axis.
How can one understand the Lorenz curve?
The following image depicts a Lorenz curve:
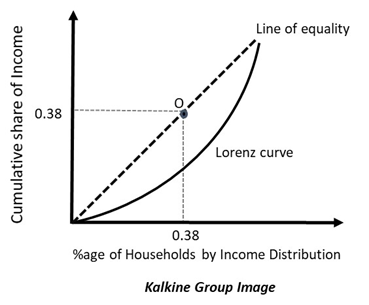
In the diagram above, the 45-degree line depicts the line of perfect equality. All points on this line depict those allocations where individuals earn equitable level of income and there are not any outliers.
The curved line is the Lorenz curve which is measured relative to the line of equality. The farther the Lorenz curve is from the line of equality, the lesser the equity in income exists in the economy. Here the upper limit on both the axes is 1 as the points are in fractions.
If a Lorenz curve is close to the line of equality, then the economy is better off and there is equitable distribution of wealth. For every point lying on the line of equality, the proportion of population is equal to the proportion of wealth. For instance, on point O, 38% of population holds 38% of the wealth in the economy.
However, the Lorenz curve that exists in real-life economies can not be equal to the line of equality as it is highly unlikely that countries are free of poverty. Thus, the straight line is more like a point of reference than an actual Lorenz curve.
Consider the diagram below, which depicts the points A and B. For point A, 55% of the population holds 20% of the wealth. This means that only a small percentage of the population holds most of the wealth. The rest of the population earns a much less amount of income.
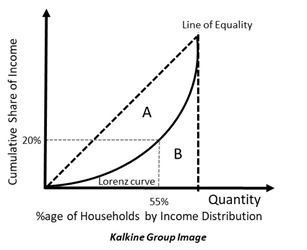
This is the reason why Lorenz curve is different from the 45-degree line. There can never be equitable distribution of wealth in real life.
What is the Gini Coefficient?
Graphically, Gini coefficient refers to the proportion of the area that exists between the 45-degree line and the Lorenz curve, and the entire area lying below the line of equity. Consider the following diagram:
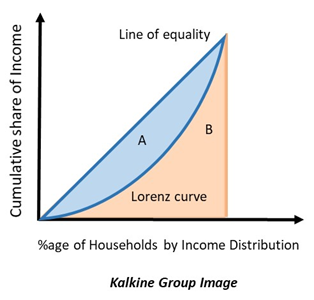
The proportion of area A to the combined area A+B is the Gini Coefficient. If there is greater inequality, then Gini coefficient will be higher as the Lorenz curve would lie farther away from the Line of equality. Thus, area A would be bigger.
The Gini coefficient is an easy way of comparing the inequality that exists between countries. It assigns a number that is universally accepted, irrespective of the population base of countries. It is one of the most prominent measures of inequality worldwide.
However, Gini coefficient has its own limitations, the main one being the fact that it is not decomposable or additive. Since it is a ratio, many different values may come out with the same Gini coefficient. This means that even if country X and Y both have the same Gini coefficient, the level of income prevailing in both might be very different.
Both Gini coefficient and Lorenz curves are used to measure inequality in the society. There are other measures as well like Atkinson’s inequality measure, Hoover index, Palma ratio, etc.
What are the advantages of Lorenz curve?
Lorenz curve is one of the simplest representations of inequality in the economy. It is a visual depiction of inequality and it can be easily understood. This allows it to be used as a measure of comparison across economies, even if the economies differ in the size of population.
Lorenz curve is plotted with the help of the numerical data given on an economy. Thus, it utilises statistical data and provides a visual touch to it.
What are the disadvantages of Lorenz curve?
Despite its many advantages, like most measures, Lorenz curve is not perfect. The limitations of Lorenz curve are the following:
- Lorenz curves may cross sometimes, giving the same level of Gini coefficient even when the absolute level of inequality may be very different in both the countries. This is a limitation of Gini coefficients too, as mentioned previously. Gini coefficients are derived from Lorenz curves themselves. So, any limitations in the Lorenz curve would be passed onto the Gini coefficient as well.
- The Gini coefficient is more sensitive to any changes in the middle portion of the population than any changes in the values lying on the extremes.
- The income approach used to measure wealth has its own set of limitations. It does not measure the wealth associated with assets, Besides, the approach does not consider the lifecycle of the population which may impact the proportion of working people and the proportion of students and old people who do not have an income. Lastly, it does not consider non-market activity that might made households financially better off.
- Gini coefficient is downward biased in small samples; thus, it may give erroneous results.
Why does the Lorenz curve not converge into the 45-degree line even in developed countries?
Even advanced countries do not have a 45-degree Lorenz curve. In fact, it has been observed that their Lorenz curves are moving in the opposite direction. It is important to note that being a wealthy nation does not mean that the wealth is distributed equally.
Usually, it is observed that the top 10% or 20% of the income earners hold a large proportion of national wealth. This means that most of the wealth in a nation is held by a few select individuals who are rich. This gap between the rich and the poor has been widening despite the technical advancements and the increase in global wealth.
This happens because the advantages of globalisation and technology do not seep down to the unskilled labour. Instead, the demand for skilled workforce is much more than the demand for unskilled labour. Thus, globalization and technological advancements both act as a disadvantage to unskilled workers as they push them away from the line of equality.
There is still a demand for workers who are highly skilled. Thus lower-skilled workforce must compete with them, which ends up hurting their case. This is why the poor population is further pushed away from equality.