
Definition
Related Definitions
Ichimoku Kinko Hyo
Ichimoku Kinko Hyo is a versatile technical indicator used to identify trends, support and resistance, gauge momentum, and to generate buy or sell signals. The name of the indicator translates into “one look equilibrium chart”.
Must read: What Is Technical Analysis?
The indicator reflects on all of the above parameters by taking multiple averages into consideration and plotting them on a chart, and the interpretation of the chart is factual in nature, i.e., it remains the same irrespective of the time frame.
Originally developed by a Japanese journalist – Goichi Hosoda in 1960s, the indicator provides more data points as compared to the traditional candlestick chart, and it could be applied on any type of chart, irrespective to the chart’s own data points, i.e., the chart could be a bar chart, a candlestick chart, or a simple line chart.
While at first glance the indicator could seem intimidating and highly technical to novice traders or investors. However, the indicator is relatively easy, and once a trader understands the nitty-gritty of its derivation and implications, it could become quite handy to gauge the market sentiment.
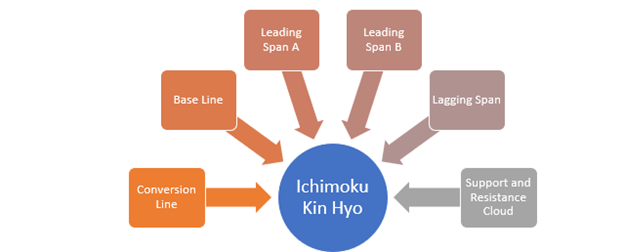
Moving Parts of Ichimoku Kinko Hyo
The Ichimoku Kin Hyo mainly contains two short-term moving averages- the conversion line (kenkan sen) and the base line (Kijun sen), one medium-term average – Leading Span A (senkou span A), one long-term moving average – Leading Span B (senkou span B), and a historical closing plot – Lagging Span (chikou span).
Derivation of Components
- The conversion line of the indicator is derived by taking the mean value of 9-period high and low.
- Likewise, the base line of the indicator is derived by taking the mean value of 26-period high and low.
- The leading Span A is typically the mean value of the conversion line and the base line.
- The leading Span B is the mean value of 52-period high and low.
- And the lagging Span is the close plot of 26-period in the past.
- Cloud 1 – Span A crosses above Span B.
- Cloud 2 – Span A crosses below Span B.
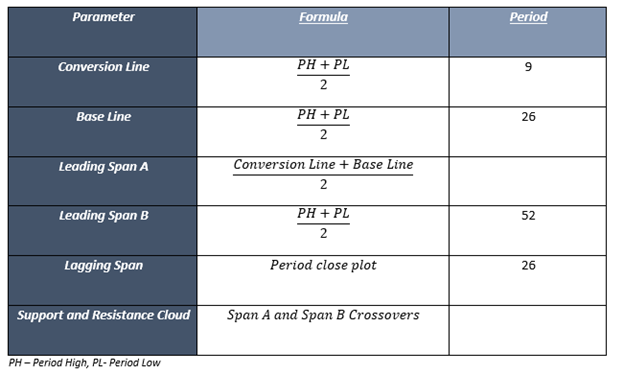
In the definition, we mentioned that the Ichimoku Kin Hyo is factual in nature; thus, in the derivation section, we have used PH and PL notions. The period here could take any from, such as daily, weekly, monthly. So, if we are applying Ichimoku kin Hyo on the daily chart, the PH and PL notion would consider 9-day high and 9-day low.
Likewise, if are applying the Ichimoku Kin Hyo indicator on a weekly chart, the PH and PL notion would consider 9-week high and 9-week low, and so on.
Interpretation
For interpreting signals from the Ichimoku, the first thing which should be considered is the crossover between the conversion line and the base line along with relative position of Span A and Span B.
- When the conversion line crosses above the base line from below, it is typically considered as a positive signal, and when the conversion line crosses the base line below from above, it is considered as a negative signal.
- Furthermore, if the positive crossover between the conversion line and the base line takes place above Span A, it reflects on the strength of the trend towards upward.
- Likewise, if the negative crossover between the conversion line and the base line takes place below Span B, it reflects on the strength of the trend towards downward.
- Ideally, if Span A trades above Span B, the trend is considered to be an uptrend.
- Likewise, if Span A trades below Span B, the trend is considered to be a downtrend.
- The behaviour of the cloud as either support or resistance depends upon the relative position of the price with respect to the cloud.
- For example, if the price of an asset is trading below cloud, the cloud acts as the resistance zone for the price.
- Likewise, if the price of an asset is trading above cloud, the cloud acts as the support zone for the price.
 { googletag.display('div-gpt-ad-5591653-3'); });
</script>
</div>
<div class=)