
Definition
Related Definitions
Gantt Chart
What is Gantt Chart?
Gantt chart was introduced in 1910 by an American mechanical engineer, Henry Gantt.
A bar chart that helps in project management is called Gantt Chart. It helps in the planning and scheduling stages. All types of projects from basic to complex can use this tool. The horizontal lines in the bar chart show the timelines and tasks. It includes start and end date, deadlines and scheduling, interdependencies between the tasks in the projects, who is the task owner and the task completed at different stages.
Chiefly, the Gantt chart is the visual representation of the project tasks displayed against time. The critical information is depicted through the chart. Gantt charts are helpful in keeping track of the task within a large team and the stakeholders in the case of change in the scope of the project.
Summary
- A Gantt chart is a project management tool which helps in managing projects by assisting in planning and scheduling stages of a project.
- It includes start and end date, deadlines and scheduling, interdependencies between the tasks in the projects, who is the ask owner and the task completed at different stages.
- Gantt charts are helpful in keeping track of the task within a large team and the stakeholders in the case of change in the scope of project.
- Gantt chart was introduced in 1910 by an American mechanical engineer, Henry Gantt
Frequently asked questions (FAQs)
What can be inferred from a Gantt chart?
Source: Copyright © 2021 Kalkine Media
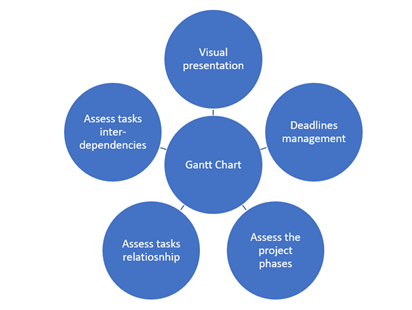
A quick glance at the Gantt chart can provide the following information-
- The whole project is displayed visually.
- The deadlines of all the tasks.
- Timeliness of all the tasks.
- Dependencies and relationship between the tasks.
- The phases of the project.
What are the advantages of using a Gantt Chart?
Project management - It is a prioritization and visualisation tool as it presents all the critical information in a single. It equips the project managers with all the crucial information which can impact the project’s deadlines, cost and quality.
Enhance communication – Lack of communication can lead to project failures. A single bar chart, Gantt chart can provide similar and crystal-clear information to all the stakeholders. On the basis of the Gantt chart analysis, the project manager can pass on the suggestions to the team members as he is updated with all critical information. Team communication and relationships are also enhanced as the scope of misunderstanding reduce significantly.
Resource management – Through the Gantt chart, the quantity of resources allocated at different stages can be inferred along with ascertaining their current utilisation. Any gap in resources can be filled by the project manager and in effect, the budget of the project can be managed optimally.
Project’s process can be monitored – The current progress can be monitored and any deviation from the deadlines can be determined easily. Additionally, the direction of the project can be regulated.
Avoids work duplication – Since the Gantt chart shows the work-in-progress, and task completed, the work duplication can be avoided. The cost, time and energy are saved to a significant extent. Furthermore, the task dependencies assessment helps in prioritising the tasks and helps in achieving the project deadline.
Time management – The time delays, duplication of work and assessment of the task interdependencies helps in managing the time frame of a project. With time allocation to each task, the projects are managed effectively.
Remote work management – Establishing coordination with a remote team is a challenging task. Gannt chart addresses this problem as all the team members are on the same page while working on a project. Regardless of the team member’s location, all members have similar information regarding the project’s different tasks.
Recognition – as the performance of the managers and team members can be tracked, it acts as a motivation and extends a great sense of accountability.
How a Gantt chart is used?
While setting up a Gantt Chart, all the tasks involved should be recognised along with a proper division of the tasks. The relationship and interdependencies between the tasks should be highlighted. After determining the order of the activities and their length, the personnel responsible for each task should be ascertained. The resources required for each task is determined and allocated. After anticipating the potential risks, a contingency plan should be created.
What are the drawbacks of using a Gantt chart?
Gantt chart is not perfect because the complexity arises due to the relationship and interdependencies between the tasks. A project plan should be straightforward and easy to understand as too much detail within a single graph can result in a loss of project progress impression.
The Gantt chart is inefficient in projecting the people required for completing a particular task and resources expended on a task. The limitation can be overcome by employing project management tools like PERT (precedence diagram).
Which Gantt chart software is best?
Following are the top-rated Gantt Chart software:
- Proof Hub
- Celoxis
- Gantt Pro
- Instagantt
- Tom’s planner
- Apache openoffice
- Microsoft project
- Project Libre
- Microsoft excels
How to choose the right Gantt software?
Software should allow sharing the information with other project members. The collaboration should be done in real-time. It should be easy to update in accordance with the project progress. Moreover, it should have the capability to get integrated with other software.
Where Gantt charts can be employed other than project management?
Gantt charts can be employed in
- Engineering,
- Marketing,
- Manufacturing Industry
- Product Launch.