
Definition
Related Definitions
Dividend Coverage Ratio
What is dividend coverage ratio?
Dividends are earnings distributed to the company's owners. Corporations need to generate adequate cash flow to cover regular expenses, expansion related investments, debt service charges and shareholder returns. Shareholders need to pay sufficient attention to the safety of dividends. The dividend coverage ratio enumerates the current dividends as a fraction of current net income.
Usually, a high dividend coverage ratio means there is no problem in maintaining the current dividend level. It signifies that the current net income adequately covers the dividend expectations of shareholders. As a result, shareholders and analysts get to know that a company can sustain shareholder returns from the available net income.
Summary
- The dividend coverage ratio assesses the sufficiency of a company's existing net income concerning its dividends.
- It establishes a relation between the earnings available for equity shareholders and the dividends paid.
- It tells the users the number of times an organisation net income can be used to pay dividends to investors during a given period.
Frequently Asked Questions (FAQ)-
How is dividend coverage ratio computed?
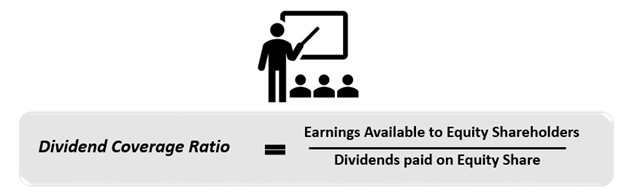
The dividend coverage ratio could be computed by distributing earnings available to equity shareholders over their dividends.
As per this approach calculation formula is -
Source: Copyright © 2021 Kalkine Media
Here, the earnings available to equity shareholders are net income after deducting tax and preference dividend payments. Dividends paid can be obtained from the cash flow statement and statement of changes in equity. While computing the ratio, it is essential to deduct any dividend paid on preference stocks from the net profit after tax. Analysts/ equity holders should adjust it in the income statement as it is a finance cost by nature.
If the result of this formula is 4, the company's earnings are four times the dividends paid during the period.
Another Indirect method to calculate the dividend coverage ratio is to take it as a reciprocal of the dividend payout ratio.

Source: Copyright © 2021 Kalkine Media
Example
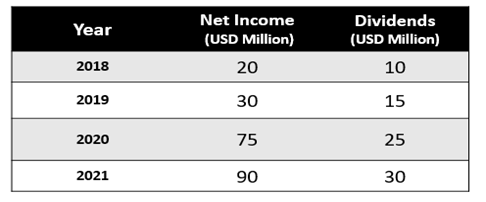
Suppose company Donor Ltd.’s historical net income and dividend payments over the last 3-years are as follows.
Source: Copyright © 2021 Kalkine Media
Assuming zero taxation and preference shares, the earnings available to equity shareholders will be the same as net income over the years.
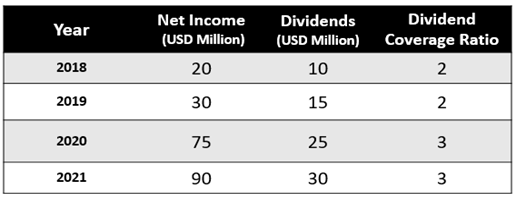
Now using the above-listed formula, the dividend coverage ratio for the Donor Ltd will be-
Source: Copyright © 2021 Kalkine Media
As per the table above, analysts and equity holders would conclude that Donor Ltd. in 2018 and 2019 could pay twice the dividends with earnings. This increased with the rising earnings and upwards revision in dividend policy for the years 2020 and 2021.
To better understand while choosing stocks for investment, shareholders can compare the dividend coverage ratio of similar firms in the industry. This will help them know which firm out of the comparable companies can best fulfil their needs for dividend security. It will also show them the capacity of various firms to sustain dividend cover if compared for several years. When data for many years is made available, the analysts and investors can comment on earnings viability. In addition, analysts can assess any impact of up or downtrends in the economy on company performance for equity holders.
Source: © Rummess | Megapixl.com
What is the importance of the dividend coverage ratio?
- Though dividend payment is a choice, companies generally maintain a reasonable dividend payout to align with market expectations.
- Investors can gauge the level of risk linked to receipt of dividends on their shares; it is especially significant to those looking for regular dividends.
- If the dividend cover is low, it may not sustain around the current level when a downward trend in profitability sets in.
- If the dividend coverage ratio is low, it could negatively impact the valuation of shares.
- It is an indication that the company can provide an actual cash return to shareholders.
- Dividend Coverage is an essential ratio to know the actual earnings ability of a company.
What are the limitations of dividend coverage ratio?
- Net income, the numerator in the formula, is not essentially proof of actual cash inflows, so the ratio, in a way, doesn't show the real cash cover for dividends unless actual cash earnings are considered for computation.
- There is no guarantee that the net income will remain the same in the future, so risk interpreted using this ratio may not always be correct.
- If the board of directors alter the dividend policy, the entire forecasts or future valuations based on dividend coverage ratio will no longer remain accurate.
- It only focuses on current earnings and dividends, doesn't provide any conclusive future expectation.
- The dividend coverage ratio cannot solely use it to determine the level of risk associated with the receipt of dividends.
What are other similar ratios like dividend coverage ratio?
The dividend coverage ratio cannot be an all-inclusive ratio for shareholders to judge the dividend policy. A few more ratios should be used along with it to know the actual position of dividend payments. These are-
Dividend payout ratio- is calculated by dividing dividends per share (DPS) by earnings per share (EPS). It can also be determined by expressing total dividend payments as a fraction of net income earned during a period. This ratio shows the part of the company's annual earnings, which is paid out in cash dividends per share. It directly takes up the actual outflows towards shareholders and not just the capacity to do so. Firms having high dividend payout ratios face trouble maintaining it over time. The dividend payout ratio should thus compare it with the industry average to get a better understanding.
Preferred dividend coverage ratio- This looks explicitly at preference dividends. The dividends on preference shares are essentially a liability and must pay. Since preference dividends are a charge on profit a company's ability to pay, it shows that the company is, in essence, debt-free. It should be seen first by equity shareholders, as it will help them understand how much of the earnings are available.