
Definition
Related Definitions
Deadweight Loss
What is Deadweight Loss?
Deadweight loss refers to the loss to society caused by market inefficiencies. Market distortions lead to a reduction in the social surplus enjoyed by firms, individuals, and the society overall. When this reduction in the social surplus is not adjusted anywhere else and goes unaccounted for, then it is known as a deadweight loss.
Deadweight loss is a burden on the economy, as it represents a level of welfare that is achievable by an economy given its production constraints. However, an external force is not allowing that potential to be achieved. This external force can come in the form of taxes, price ceiling, price flooring.
When the demand and supply are not in equilibrium then a deadweight loss arises. Thus, it is a cost to the society and it reduces the overall welfare of a society.
Under what circumstances a deadweight loss occurs?
- Taxes: Consider the case of an economy in equilibrium. There is no deadweight loss and the producers continue to gain producer surplus, while the consumers continue to gain consumer surplus. This can be represented through the following graph:
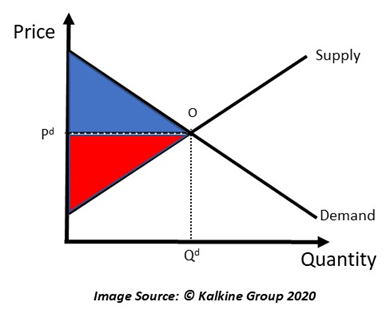
Here the market determined price is Pd, while the market determined quantity is Qd. The red triangle, which represents the area above the supply curve till the price line, is the producer surplus. Whereas, the blue triangle, which represents the area below the demand curve till the price line, is the consumer surplus. Both consumer and producer surplus are integral to the welfare of the society as they increase the utility of consumer and producer, respectively.
Now suppose a tax is introduced into this framework. This is a market distortion, as the optimal price and quantity levels would change now.
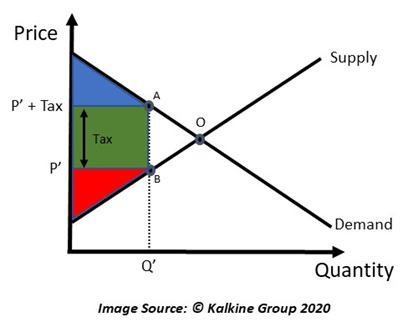
In the above diagram, a distortion is visible, as the prices for the producer have fallen considerably, below Pd in the previous diagram. Moreover, the price charged to the consumers, equal to P’ + Tax, is much higher than the optimal level Pd in the previous diagram.
Because of the taxes imposed, the consumer and producer surplus have shrunk down. Producer surplus, represented by the red triangle, is visibly lesser than what it was in the previous diagram. Whereas, the consumer surplus, represented through the blue triangle, has also shrunk.
Part of these lost surpluses are transferred to the government through tax revenue, while part of them are wasted. The green box in the middle is the revenue of the tax received by the government.
The triangle OAB is the surplus that goes wasted and is not adjusted anywhere else. This is the deadweight loss.
Another important aspect to notice is that the overall production in the economy is reduced from the optimal Qd to Q’. The overall welfare of the society is reduced by an amount equal to the area of triangle OAB.
- Price Ceiling and Price Floors: Price ceiling and price flooring are opposite cases. Price ceilings refer to government regulations imposed on sellers beyond which they can not charge for their products. This prevents sellers from charging above a certain fixed amount. As price ceilings are implemented, production becomes less incentivising for the producers and output falls. Thus, there is a lack of supply as compared to the demand for the good.
Similarly, price floors are like a lower bound, set by the government, below which they cannot charge their customers. Minimum wages can be considered an example of price flooring. Firms that are unable to pay even the minimum wages mandated by the government would have to lay off workers. This leads to an increase in unemployment which reduces the total output in the economy. Thus, increased unemployment is a deadweight loss.
- Monopoly: The scenario of a monopoly is exactly like the scenario of a tax. The difference being the fact that the revenue collection is done by the producer and not the government.
Monopolies charge prices that are much higher than the marginal cost. This effectively resembles the case of a tax, where prices increase for the consumer because of the tax. A major difference is also the fact that the revenue collected under monopolies are all a part of producer surplus, therefore, this surplus is not utilised as public expenditure.
How is Deadweight loss calculated?
Consider the following diagram:
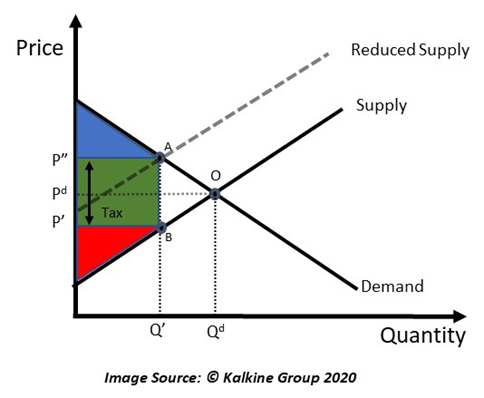
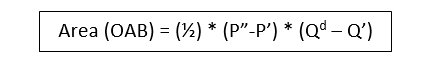
As the tax is implemented, the supply curve reduces as shown above. The consumers are paying price P”, while the producers are earning price P’. Quantity has been reduced to Q’.
The area of triangle OAB can be derived using the formula for the area od triangle, which is
Therefore, area of triangle OAB is
What factors affect the quantity of the deadweight loss?
The elasticity of the demand and supply curves determine the quantity of the deadweight loss. When the demand or supply or both the curves are inelastic, then the deadweight loss is smaller. This happens because the quantity varies less with price in such cases.
However, if either of the curves are highly elastic, then the deadweight loss would be high. This happens because the quantity adjusts easily with prices. Therefore, as prices increase with taxation, quantity demanded would immediately fall, while the quantity supplied would increase.
Therefore, it would make sense for the government to tax the inelastic goods, as they would not create as much deadweight loss as the elastic goods. However, deadweight loss cannot be eliminated. Therefore, distortionary practices like taxes, subsidies, price ceilings and floorings as well as the formation of a monopoly should be highly regulated before they are implemented.