
Definition
Related Definitions
Beta
What is Beta?
Beta is a measure of volatility associated with a stock or investment portfolio, indicating the degree of fluctuations in comparison to the overall stock market. Significantly, the stock market is exposed to market risk or systematic risk, which arises due to several macroeconomic factors, such as the political scenario, economic situation, war, pandemic, etc.
However, a particular investment or stock may show more significant fluctuations compared to the overall market movement.
The beta is used to compare the extent of the potential volatility of the stock relative to the stock market. It is also called as Financial Elasticity since it measures the degree of change of the stock value in comparison to the entire market.
Since the market is considered to be the benchmark for gauging the market risk of other stocks or securities, its value is considered to be 1.
It must be noted that stock or securities with higher beta value also signify higher returns along with the increased risks.
Why is Beta Used?
The investors have varying risk-appetite depending upon their financial situation, current obligations, plans and psychological construct. The different risk-return profile of the securities gives idea about the risk to the stockholders. Thus, they can ensure that the investment they are choosing does not involve higher risk than they can bear.
Notably, the risk associated with the portfolio can be both systematic and unsystematic. The systematic risk is the market risk and cannot be eliminated with any amount of diversification. The unsystematic risk is the risk inherent to a particular stock or company and can substantially be mitigated via diversification.
Read: Simple Ways to Build a Diversified Investment Portfolio
Thus, the stock market slump following the COVID-19 pandemic is the systematic risk. However, a company aggressively following an expansion strategy is prone to unsystematic risks due to the threats in the different markets and competitive factors.
The beta here comes into play for analysing if the ongoing or prospective endeavors of the company would overall increase/decrease the company’s risk as opposed to the market. The higher volatility would mean higher swings demonstrated by the stock of that company. It also aids in providing insights to the investors about the direction of the stock in relation to that of the market.
The analysts use the concept of beta in the fundamental analysis for determining the risk-reward inherent in a portfolio and determine the sensitivity of the stock compared to the market.
Good read: Investing Basics: 5 things to consider in case of a Diversified Portfolio
How to Calculate Beta?
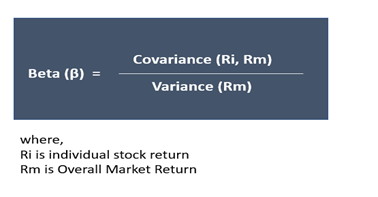
Beta is the ratio between the covariance of the product of Stock return and Market Return and the variance of the overall market return.
Steps involve in Calculation:
Covariance (Ri, Rm)
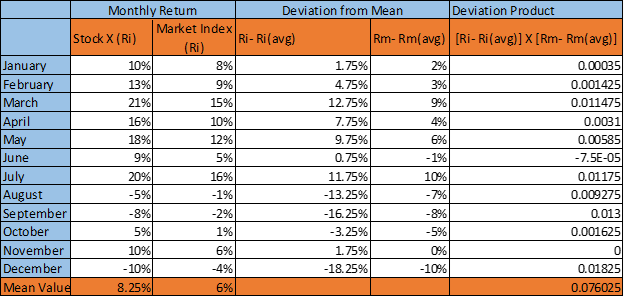
- Gather the data (Say monthly) of the returns generated by the stock (Ri) over a period (say for a year). The number of observations is n (12 months here)
- Gather similar data set for the market index (Rm) return over the same period
- Calculate the mean return for the Stock (Riavg) and the mean return of the market index (Rmavg) over the period.
- Calculate the difference between the stock return and mean stock return (Ri- Riavg) for each observation. For example, subtract the ‘mean stock return’ from the ‘stock return for January’ and so on (for other 11 months here). Repeat the same for market index return (Rm- Rmavg) for every observation.
- Multiply (Ri- Riavg) with (Rm- Rmavg) against each observation.
- Add all the products of (Ri- Riavg) x (Rm- Rmavg), which was calculated for each observation and divide the sum by n-1 to get the Covariance (Ri, Rm)
Kalkine Image
Riavg= 8.25%
Rmavg= 6%
Σ (Ri- Riavg) X (Rm- Rmavg) = 0.076
Covariance (Ri, Rm) = Σ (Ri- Riavg) X (Rm- Rmavg)/ n-1 = 0.076/11= 0.00691
Variance (Rm)
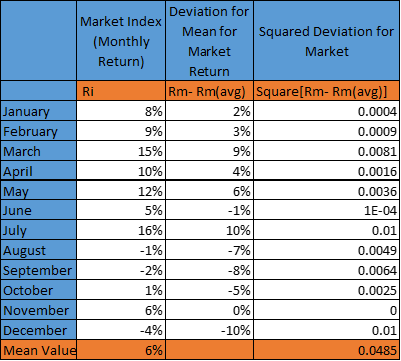
- Take the difference of the market return and average market return- (Rm- Rmavg) for each observation (calculated above in step 4)
- Square the difference, that is (Rm- Rmavg)2 for each observation
- Add all the squared differences for market return and divide the sum by n-1 to get the Variance (Rm)
Kalkine Image
Variance (Rm)= Σ (Rm- Rmavg)2/ (n-1) = 0.0485/11= 0.00441
Beta = Covariance (Ri, Rm)/ Variance (Rm) = 0.00691/ 0.00441 = 1.567
The Beta can be calculated on excel using the slope functions
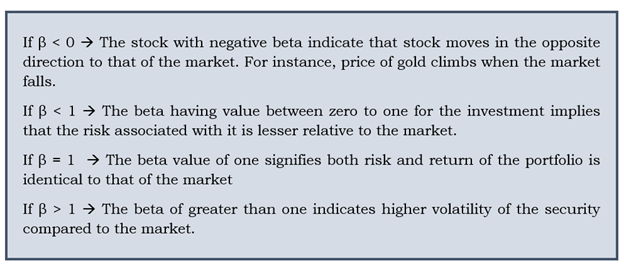
Interpretations from Value of Beta
The value of beta indicates the risk and volatility of the stock compared to that of the market. The different values of beta for the stock or investment portfolio indicates:
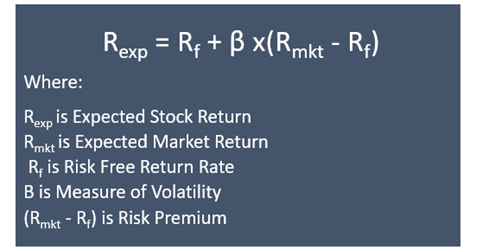
Use of Beta in the CAPM Model
Beta, a measure of volatility is used in the CAPM model for indicating the risk-return tradeoff for the investment. The CAPM model encapsulates the concept of Market Risk Premium, considering that riskier stocks generate a higher return.
The risk premium is the additional return apart from the return on the risk-free rate that the investor can earn, provided one is ready to take the additional risks in their investment.
What are the Advantages and Disadvantages associated with the beta?
Advantages
- Beta helps offer insight concerning where the stock stands in terms of volatility and returns compared to the market. Based on the understanding, the investors can be guided to make the right decisions to build a portfolio.
- The numerical value of beta calculated through the statistical measure provides a clear understanding of the stock’s volatility.
Disadvantages
- The beta value is calculated on the historical price movements and does not include current undertakings and prospects, which bears strong significance to the market return
- The inadequate price history can limit its ability to predict the price movement.