
Definition
Related Definitions
Activity Ratios
What Are Activity Ratios?
Activity ratios are defined as metrics that measure the efficiency of operational activities of a company, i.e., they reflect on a company’s ability to leverage its assets to generate revenue and cash. Activity ratios are sometimes also referred to as asset utilization ratios or operational efficiency ratios.
What Do Activity Ratios Gauge?
Activity ratios are financial metrics that help an analyst to gauge the effectiveness of a company in generating a unit of revenue/cash by utilising a unit of asset.
Also, activity ratios reflect upon the inventory management of a company, which acts as a pivotal component in operational fluidity and the overall fiscal health.
Activity ratios combine information from the income statement and the balance sheet to measure how efficiently a company utilises its assets.
Many financial analysts average the figures from the balance sheet while calculating the activity ratios as the balance sheet only shows the financial condition at the end of the period while income statement measures the activities during a period.
Activity Ratios – Forms, Calculation, Interpretation, and Limitations
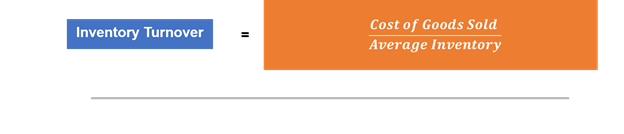
Inventory Turnover Ratio
Inventory turnover is one of the most important measures from the operational standpoint for a company as it captures the efficiency with which the inventory of the company is managed. Generally, a higher inventory ratio is desirable as it reflects a shorter holding period for the inventory.
Also, a higher inventory turnover ratio indicates a higher movement of goods from business to clients and a large frequency of replenishment.
Likewise, a low inventory turnover ratio implies overstocking, which increases the risk of inventory becoming obsolete, and it also reflects on poor marketing or declining demand for a company’s product.
- Days of Inventory on Hand (DOH)
A related ratio to the inventory turnover ratio is the Days of Inventory on Hand (DOH) which reflects the number of days the inventory of a company was on hand during a period.
Calculating DOH is relatively simple, where analysts just distribute the inventory turnover into the number of days in a period. So, for example, if the inventory turnover for a company during a period is 12, its DOH would be roughly 30.42 or 30 days.
A DOH of 30 days suggests that on an average it takes 30 days for the company to sell its inventory. Therefore, a higher inventory turnover ratio leads to lower DOH; thus, it is more desirable.
Accounts Receivable Turnover Ratio
The accounts receivable turnover ratio or debtor’s ratio measures the efficiency of a company to convert its accounts receivable into cash. A relatively high receivable turnover ratio might indicate highly efficient credit and collection.
Ideally, the accounts receivable ratio is not very useful on a standalone basis and should be compared in cross-sectional or time-series setting against the peer/industry group to understand the effectiveness of a company in converting credit into revenue.
It does not work well on a standalone basis as a higher ratio usually reflects tighter credit policies, and thus, a loss of sales opportunity. Likewise, a low ratio indicates that the company is pushing sales by reducing the credit requirements, which could lead to problems concerning the cash collection.
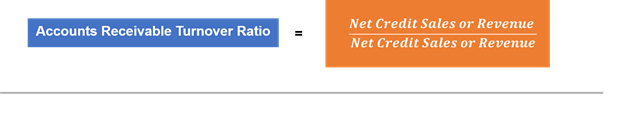
Also, some financial analysts and financial models use revenue in the numerator to capture the ability of a company in converting its account receivable into revenue or cash.
- Days of Sales Outstanding
A related ratio to the accounts receivable turnover is the Days of Sales Outstanding (DSO) that represents the elapsed time between a sale and cash collection.
Ideally, DSO represents how fast a company collects cash from customers to whom it offers credit. DSO is simply calculated by dividing the number of days in a period with the accounts receivable turnover ratio.
So, for example, if a company’s accounts receivable turnover ratio is 30; it takes the company 30 days to convert its credit into cash.
If an analyst uses revenue in the numerator, then a higher accounts receivable turnover ratio should be ideally desired as it would lead to a low DSO.
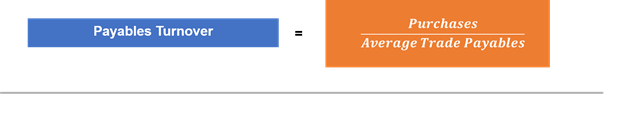
Payables Turnover
Payable turnover ratio is a metric that theoretically measures the number of times a company completely pays its creditors during a period. Ideally, for the calculation purposes, the ratio assumes that the company makes all its purchases using credit.
Generally, the amount value at which the company had made a purchase is not easily available; thus, financial analysts calculate the same by adding the value of the cost of goods sold with the net inventory for the period (beginning – ending).
Ideally, high payable turnover reflects that the company is not using all the credit facilities available to make the purchase. Alternatively, a high payable turnover ratio could also result from a company taking advantage of early payment discounts.
Therefore, the payables turnover ratio is also not very insightful on a standalone basis.
- Number of Days of Payables
A related ratio to the payable turnover is the Number of Days of Payables that represents the average number of days a company takes to pay its suppliers and is calculated by dividing the number of days in a period with the payable turnover ratio.
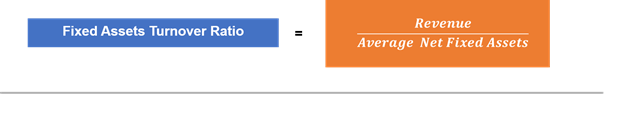
Fixed Assets Turnover Ratio
Fixed assets turnover ratio measures a company’s efficiency in generating each unit of revenue from a unit of fixed assets. Ideally, a higher ratio is desirable as it reflects on the strong ability of a company for generating revenues for its investments in fixed assets.
However, a low ratio cannot be rejected without enquiring into certain factors as a capital-intensive business environment, new business not yet operating at full capacity could show a low fixed assets turnover.
Also, fixed assets turnover could be low for companies with comparatively new assets with less depreciation having a higher carrying value on the books.
Therefore, the fixed assets turnover ratio should not be used on a standalone basis. Also, they are not very insightful on a time-series setting as well as fixed assets may not follow a steady year-on-year growth as revenue.
Total Assets Turnover Ratio
Total assets turnover ratio measures a company’s ability in generating each unit of revenue from a unit of total assets. Thus, a ratio of 2.0 would indicate that a company is generating $2 revenue for every $1 of total assets.

Therefore, a higher total assets turnover ratio is usually desired; however, a low ratio cannot be rejected straightforward in the context of analysis as it could be due to the relative capital intensity of a business.